
Investors that have endured the violent correction in gold miners (GDX) have finally received some reprieve, with the gold price on firmer footing this month. Since the beginning of October, the gold price (GLD) has climbed 3%, with the silver price (SLV) leading the way. This is great news for the silver/gold ratio, which was under pressure, and also for the technical picture, with the gold price continuing to trade above the key $1,750/oz level. The combination of depressed sentiment, an improvement in the silver/gold ratio, and most miners trading at a discount to NAV suggests that the worst is behind us, and better days are ahead. Let’s take a closer look below:
(Source: Daily Sentiment Index Data, Author’s Chart)
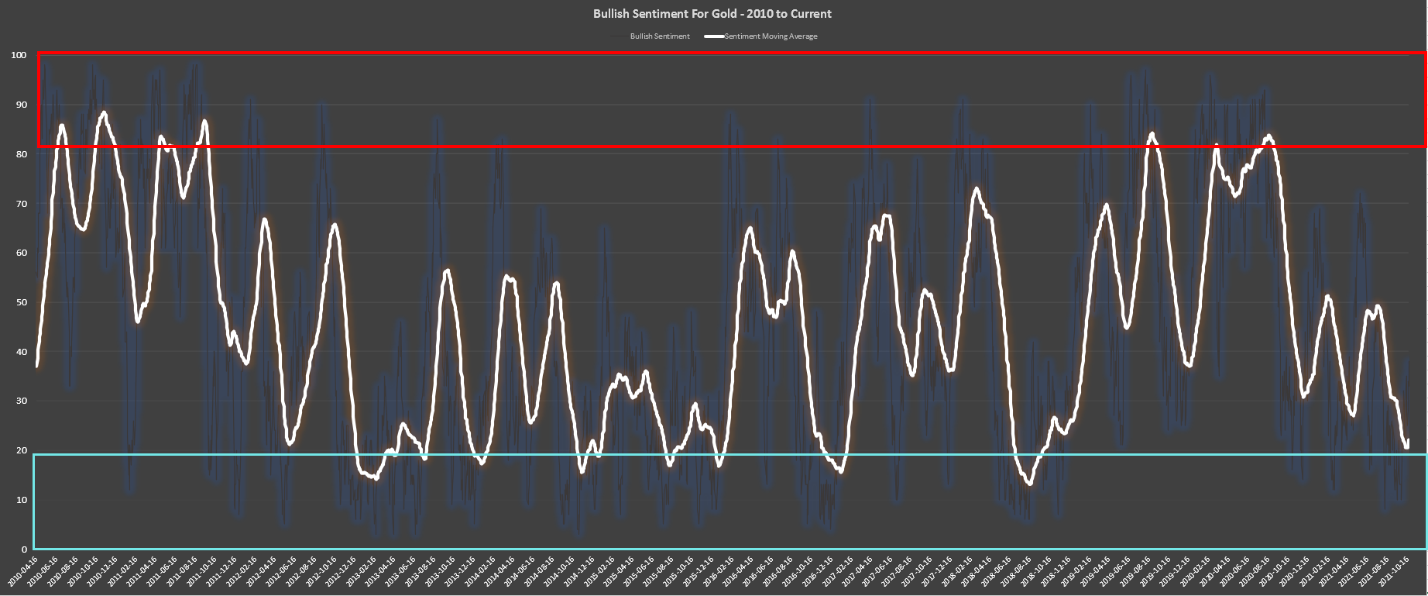
Beginning with sentiment, we saw bullish sentiment for gold fall to its lowest levels in years earlier this month, with prior signals leading to double-digit forward returns over the next 12 months. As the chart below shows, while the continued pessimism in gold did not hit a buy signal, it came the closest to one that it has since September 2018, a level that the metal has not traded below since. Signals of this magnitude typically breed multi-month rallies in the mining sector, and the downside for gold is usually limited over the next year. So, based on this signal, the 1-year forward range for gold is likely to be $1,680/oz to $2,100/oz, pointing to an attractive reward/risk proposition.
(Source: TC2000.com)
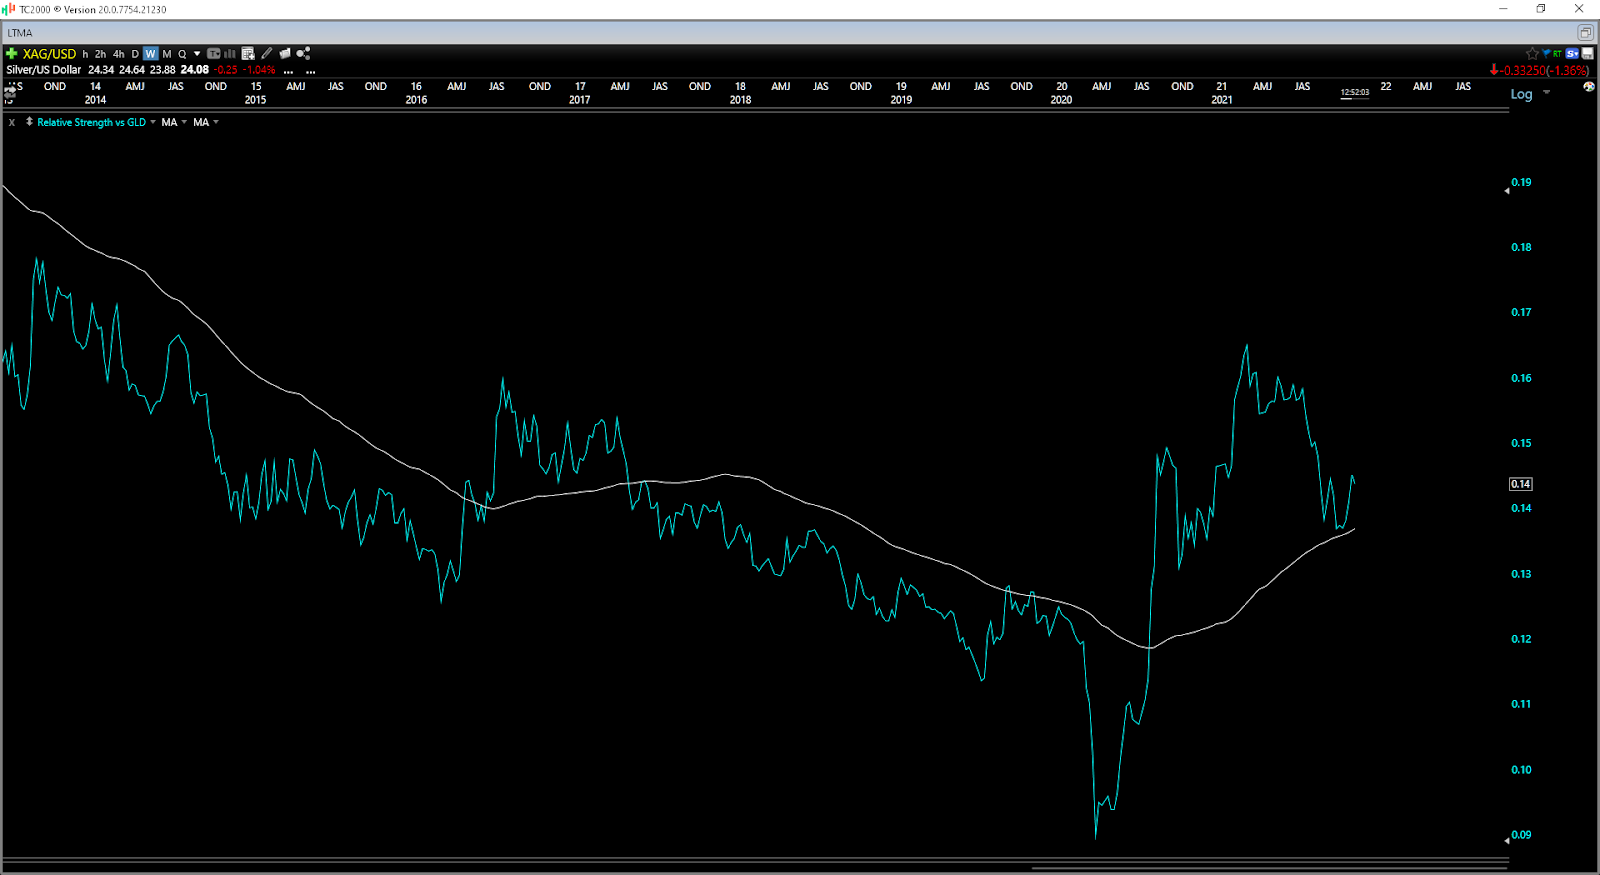
Moving to the silver/gold ratio, the recent weakness in this indicator has been a reason to be a little cautious, given that the healthiest precious metal bull markets see silver outperform gold. Until recently, this indicator remained under pressure, with the gold/silver ratio rising above 80. Fortunately, the ratio reversed sharply and held a pivotal support level. Assuming the silver/gold ratio continues to trend higher, this increases the probability of this being a cyclical bear market in gold vs. a peak in metals prices, meaning the past 13 months have been a shakeout, not the start of a violent bear like we saw in 2012-2015.

(Source: TC2000.com)
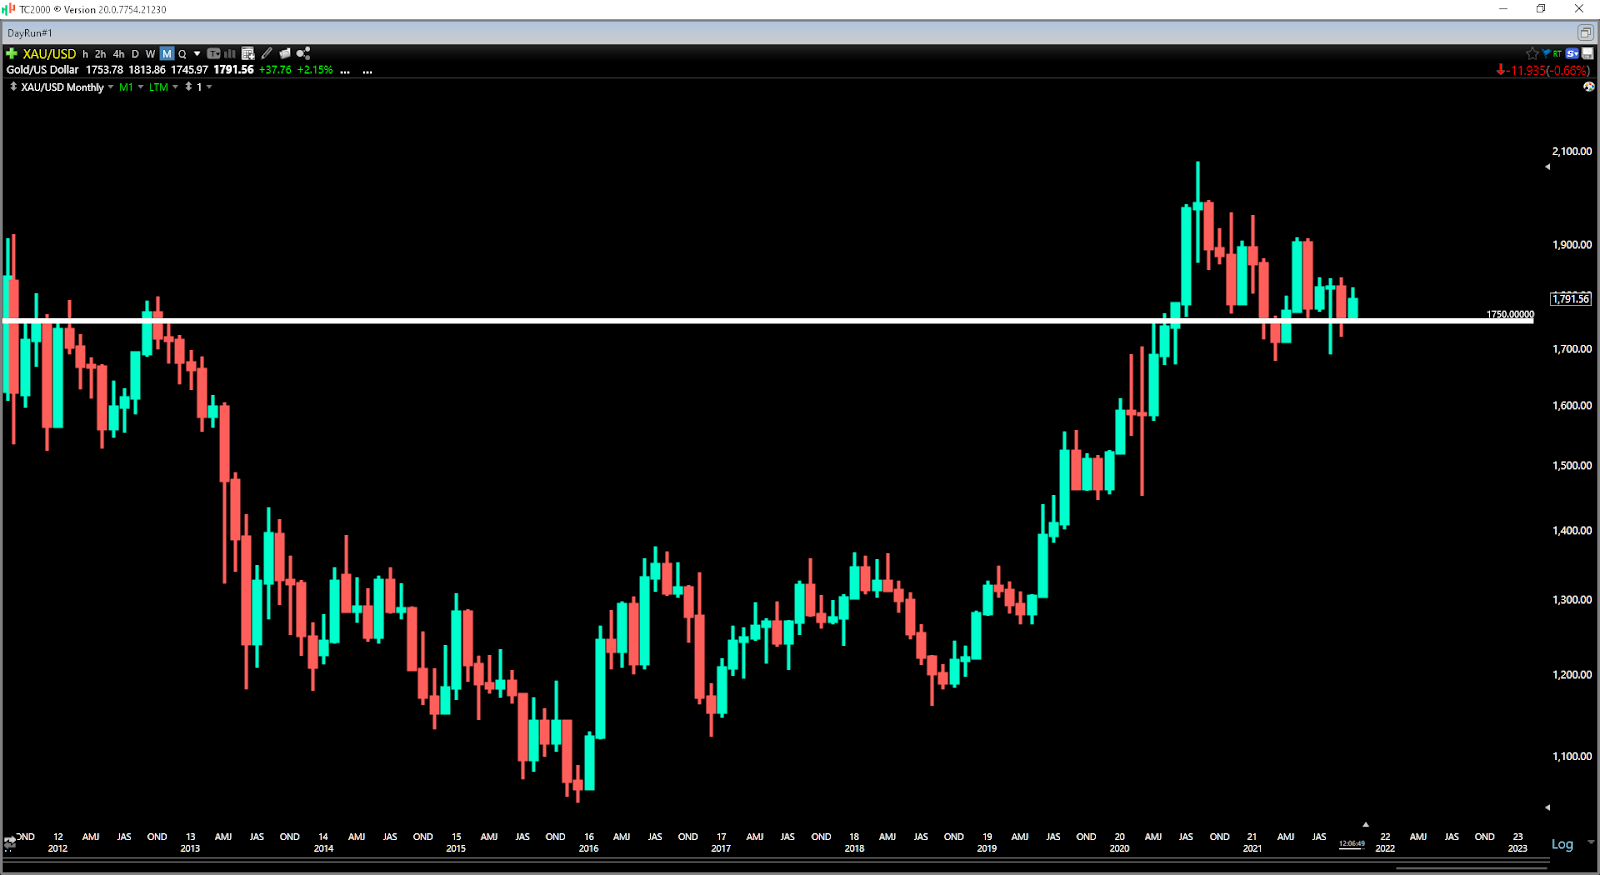
Finally, while the gold price is quite volatile and the short-term picture receives most of the attention, the big picture is the most important and all that matters. As the monthly chart shows below, gold spent several months battling at the $1,750/oz level in 2011 through 2012 before finally succumbing to selling pressure. A decade later, the metal is once again battling at this pivotal level, but this time around it’s support. Obviously, there’s no guarantee that this level holds, but for now, we have seen a clear change of character with any pullbacks below $1,750/oz being bought up immediately. As long as this remains the case, my 18-month target for gold continues to be $2,250/oz or higher.
(Source: TC2000.com)
So, what’s the best course of action?
Given the continued buying pressure at $1,750/oz, I would view any pullbacks below this level as shakeouts and opportunities to add to one’s position in gold. For those looking for leverage to the gold price, I see names like Osisko Mining (OBNNF) being the most attractive, sitting on high-grade gold deposits in safe jurisdictions and likely to become takeover targets for cash-rich producers. In Osisko’s case, the company looks to be sitting on a resource base of more than 7 million ounces of gold at an average grade of more than 9 grams per tonne and should be producing 250,000 ounces per annum by 2025 at 65% margins. At a valuation of $800 million and less than 0.75x P/NAV, I see the stock as severely undervalued at current levels, with a fair value closer to US$3.80 per share.
Disclosure: I am long GLD, OBNNF
Disclaimer: Taylor Dart is not a Registered Investment Advisor or Financial Planner. This writing is for informational purposes only. It does not constitute an offer to sell, a solicitation to buy, or a recommendation regarding any securities transaction. The information contained in this writing should not be construed as financial or investment advice on any subject matter. Taylor Dart expressly disclaims all liability in respect to actions taken based on any or all of the information on this writing.