
The Hourly View for MEOH
At the moment, MEOH (Get Ratings)’s price is down $-0.38 (-0.93%) from the hour prior. The hourly chart shows that MEOH has seen 2 straight down hours. If you’re a trend trader, consider that the strongest clear trend on the hourly chart exists on the 100 hour timeframe. The moving averages on the hourly timeframe suggest a bullishness in price, as the 20, 50, 100 and 200 are all in a bullish alignment — meaning the shorter durations are above the longer duration averages, implying a sound upward trend.
Out of Chemicals stocks, MEOH ranks 42nd in regards to today’s price percentage change.
MEOH’s Technical Outlook on the Daily Chart
At the time of this writing, MEOH’s price is down $-0.46 (-1.12%) from the day prior. This is a reversal of the price action on the previous day, in which price moved up. If you’re a trend trader, consider that the strongest clear trend on the daily chart exists on the 50 day timeframe. The moving averages on the daily timeframe suggest a choppiness in price, as the 20, 50, 100 and 200 are all in a mixed alignment — meaning the trend across timeframes is inconsistent, indicating a potential opportunity for rangebound traders. Methanex Corp’s price action over the past 90 days can be seen via the chart below.
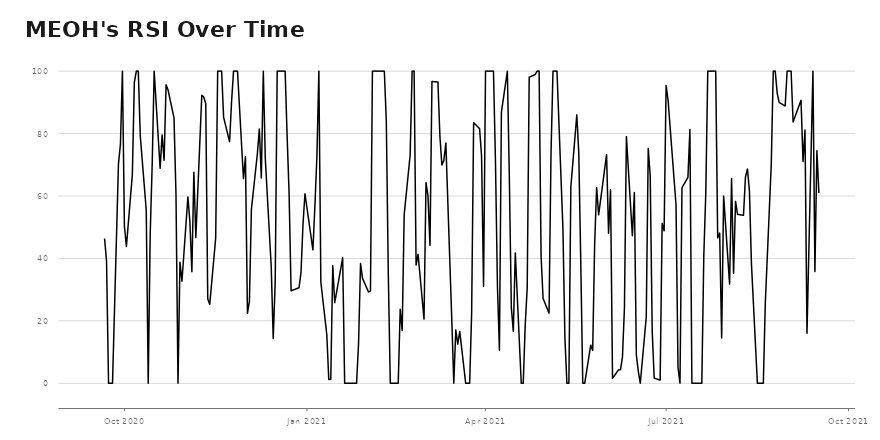
MEOH: Daily RSI Analysis
- MEOH’s RSI now stands at 60.9329.
- Note: MEOH and RSI appear to be diverging in terms of their respective trends, with MEOH rising at a faster rate than RSI.
Want More Great Investing Ideas?
9 “MUST OWN” Growth Stocks for 2021
5 WINNING Stock Chart Patterns
7 Best ETFs for the NEXT Bull Market