
The Hourly View for CTS
Currently, CTS (Get Ratings)’s price is up $0.07 (0.23%) from the hour prior. This is the 2nd hour in a row CTS has seen its price head up. Regarding the trend, note that the strongest trend exists on the 50 hour timeframe. The moving averages on the hourly timeframe suggest a bearishness in price, as the 20, 50, 100 and 200 are all in a bearish alignment — meaning the shorter duration moving averages are below the longer duration averages, implying a stable downward trend.
CTS ranks 19th in terms of today’s price percentage change out of Electronic Equipment stocks.
CTS’s Technical Outlook on the Daily Chart
Currently, CTS’s price is up $0.22 (0.73%) from the day prior. It’s been a feast for bears operating on the daily timeframe, as CTS has now gone down 4 of the past 5 days. If you’re a trend trader, consider that the strongest clear trend on the daily chart exists on the 50 day timeframe. The moving averages on the daily timeframe suggest a choppiness in price, as the 20, 50, 100 and 200 are all in a mixed alignment — meaning the trend across timeframes is inconsistent, indicating a potential opportunity for rangebound traders. Cts Corp’s price action over the past 90 days can be seen via the chart below.
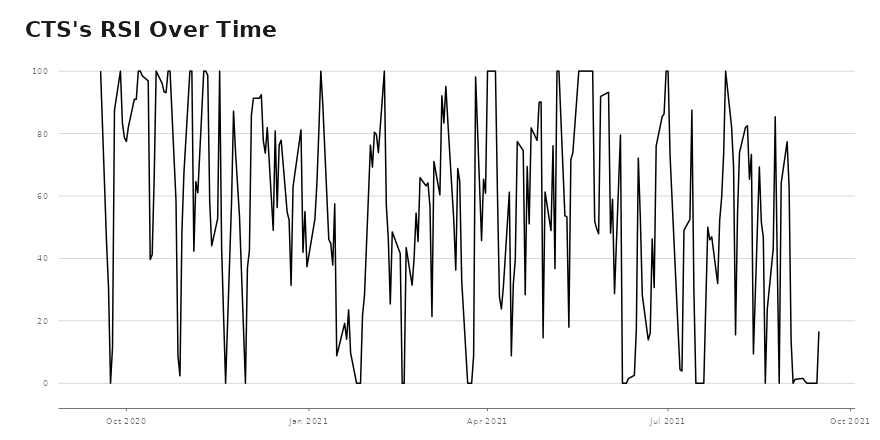
CTS: Daily RSI Analysis
- For CTS, its RSI is now at 16.6052.
- CTS and RSI both have consistent trends, as they are both heading down.
Want More Great Investing Ideas?
9 “MUST OWN” Growth Stocks for 2021
5 WINNING Stock Chart Patterns
7 Best ETFs for the NEXT Bull Market