The Hourly View for RLI
Currently, RLI (Get Ratings)’s price is down $-0.37 (-0.35%) from the hour prior. RLI has seen its price go down 5 out of the past 5 hours, thus creating some compelling opportunities for bears. If you’re a trend trader, consider that the strongest clear trend on the hourly chart exists on the 50 hour timeframe. The moving averages on the hourly timeframe suggest a bearishness in price, as the 20, 50, 100 and 200 are all in a bearish alignment — meaning the shorter duration moving averages are below the longer duration averages, implying a stable downward trend.
Out of Insurance stocks, RLI ranks 83rd in regards to today’s price percentage change.
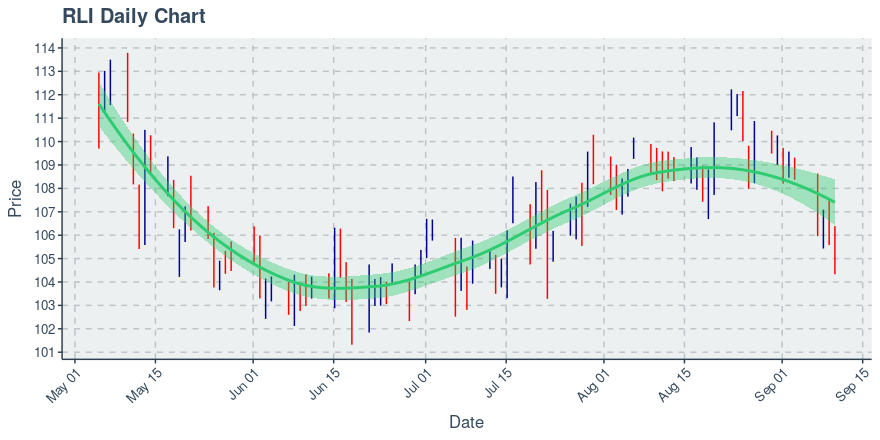
RLI’s Technical Outlook on the Daily Chart
At the moment, RLI’s price is down $-1.06 (-1%) from the day prior. It’s been a feast for bears operating on the daily timeframe, as RLI has now gone down 4 of the past 5 days. If you’re a trend trader, consider that the strongest clear trend on the daily chart exists on the 20 day timeframe. Of note is that the 50 day changed directions on RLI; it is now pointing down. The moving averages on the daily timeframe suggest a bullishness in price, as the 20, 50, 100 and 200 are all in a bullish alignment — meaning the shorter durations are above the longer duration averages, implying a sound upward trend. Rli Corp’s price action over the past 90 days can be seen via the chart below.
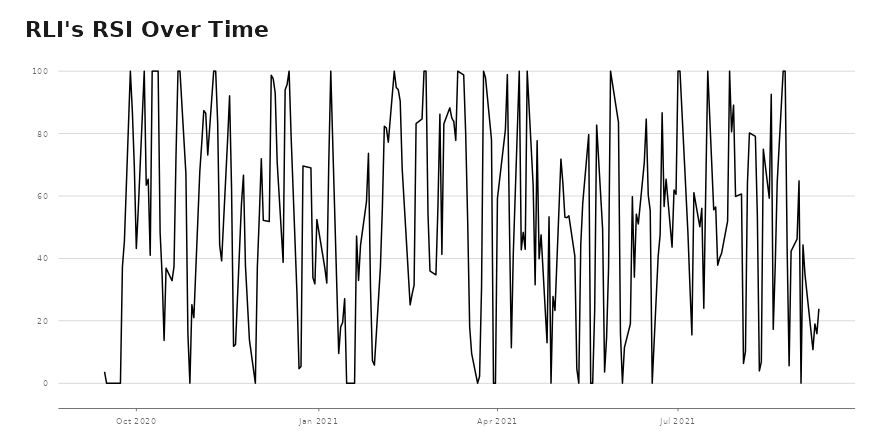
RLI: Daily RSI Analysis
- For RLI, its RSI is now at 23.8619.
- RLI and RSI both have consistent trends, as they are both heading down.
Want More Great Investing Ideas?
9 “MUST OWN” Growth Stocks for 2021
5 WINNING Stock Chart Patterns
7 Best ETFs for the NEXT Bull Market