
The Hourly View for VEEV
Currently, VEEV (Get Ratings)’s price is up $3.96 (1.2%) from the hour prior. This move is a reversal from the hour prior, which saw price move down. Regarding the trend, note that the strongest trend exists on the 100 hour timeframe. Regarding moving averages, it should first be noted that price has crossed the 20 and 50 hour moving averages, resulting in them so that price is now turning above them. The moving averages on the hourly timeframe suggest a bullishness in price, as the 20, 50, 100 and 200 are all in a bullish alignment — meaning the shorter durations are above the longer duration averages, implying a sound upward trend.
VEEV ranks 69th in terms of today’s price percentage change out of Business Services stocks.
VEEV’s Technical Outlook on the Daily Chart
At the time of this writing, VEEV’s price is up $0.55 (0.17%) from the day prior. It’s been a feast for bulls operating on the daily timeframe, as VEEV has now gone up 4 of the past 5 days. Regarding the trend, note that the strongest trend exists on the 20 day timeframe. The moving averages on the daily timeframe suggest a bullishness in price, as the 20, 50, 100 and 200 are all in a bullish alignment — meaning the shorter durations are above the longer duration averages, implying a sound upward trend. The chart below shows VEEV’s price action over the past 90 days.
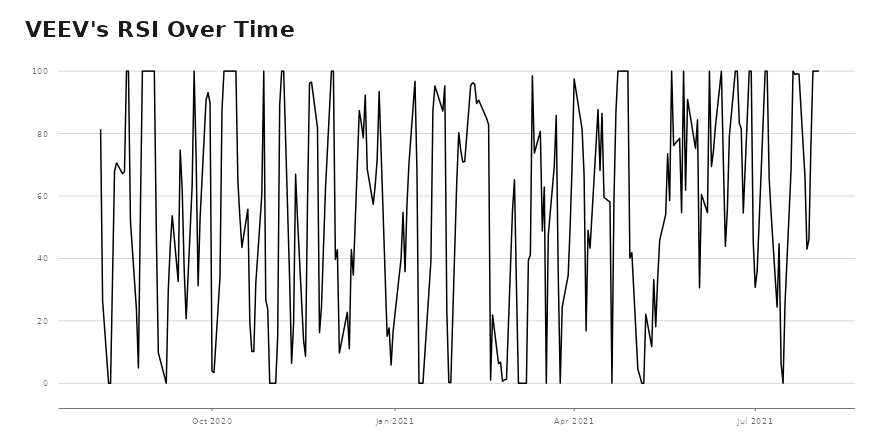
VEEV: Daily RSI Analysis
- VEEV’s RSI now stands at 100.
- VEEV and RSI both have consistent trends, as they are both heading up.
Want More Great Investing Ideas?
9 “MUST OWN” Growth Stocks for 2021
5 WINNING Stock Chart Patterns
7 Best ETFs for the NEXT Bull Market