
The Hourly View for SHW
At the time of this writing, SHW (Get Ratings)’s price is down $-0.02 (-0.01%) from the hour prior. This is the 2nd hour in a row SHW has seen its price head down. If you’re a trend trader, consider that the strongest clear trend on the hourly chart exists on the 50 hour timeframe. The moving averages on the hourly timeframe suggest a bullishness in price, as the 20, 50, 100 and 200 are all in a bullish alignment — meaning the shorter durations are above the longer duration averages, implying a sound upward trend.
SHW ranks 123rd in terms of today’s price percentage change out of Retail stocks.
SHW’s Technical Outlook on the Daily Chart
Currently, SHW’s price is down $-1.32 (-0.46%) from the day prior. This move is a reversal from the day prior, which saw price move up. As for the trend on the daily timeframe, we see the clearest trend on the 20 day timeframe. The moving averages on the daily timeframe suggest a bullishness in price, as the 20, 50, 100 and 200 are all in a bullish alignment — meaning the shorter durations are above the longer duration averages, implying a sound upward trend. The chart below shows SHW’s price action over the past 90 days.
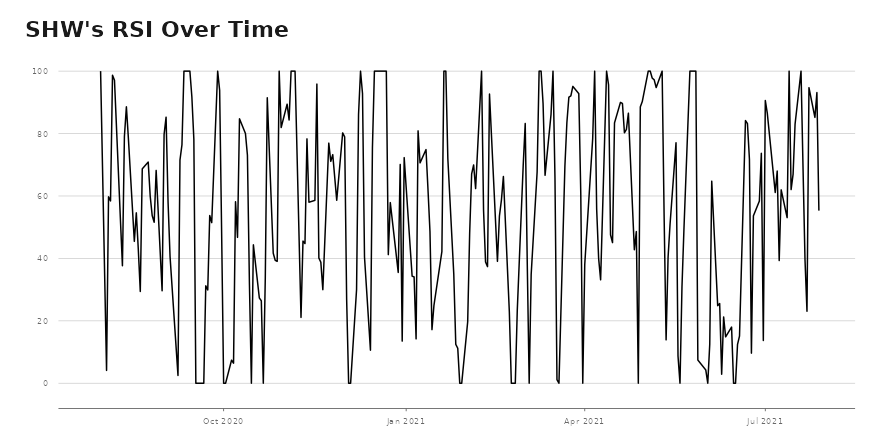
SHW: Daily RSI Analysis
- For SHW, its RSI is now at 55.3086.
- SHW and RSI may be exhibiting divergent trends. This may be something to monitor.
For SHW News Traders
Investors and traders in SHW may be particularly interested in the following story that came out in the past day:
Sherwin Williams EPS beats by $0.06, misses on revenue
Sherwin Williams (SHW): Q2 Non-GAAP EPS of $2.65 beats by $0.06; GAAP EPS of $2.42 misses by $0.01.Revenue of $5.38B (+17.0% Y/Y) misses by $10M.The company expects FY2021 diluted net income per share in the range of $9.15 to $9.45 per share vs. consensus of $9.23.Shares +0.18% PM.Press Release…
Want More Great Investing Ideas?
9 “MUST OWN” Growth Stocks for 2021
5 WINNING Stock Chart Patterns
7 Best ETFs for the NEXT Bull Market