The Hourly View for LDOS
At the moment, LDOS (Get Ratings)’s price is down $-0.4 (-0.38%) from the hour prior. The hourly chart shows that LDOS has seen 2 straight down hours. Regarding the trend, note that the strongest trend exists on the 100 hour timeframe. The moving averages on the hourly timeframe suggest a bullishness in price, as the 20, 50, 100 and 200 are all in a bullish alignment — meaning the shorter durations are above the longer duration averages, implying a sound upward trend.
Out of Computers stocks, LDOS ranks 57th in regards to today’s price percentage change.
LDOS’s Technical Outlook on the Daily Chart
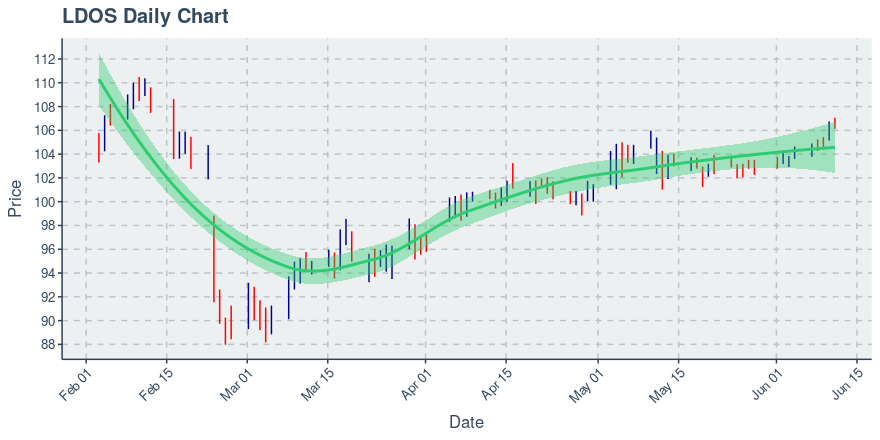
Currently, LDOS’s price is down $-0.55 (-0.52%) from the day prior. LDOS has seen its price go up 4 out of the past 5 days, thus creating some compelling opportunities for bulls. If you’re a trend trader, consider that the strongest clear trend on the daily chart exists on the 50 day timeframe. The moving averages on the daily timeframe suggest a bullishness in price, as the 20, 50, 100 and 200 are all in a bullish alignment — meaning the shorter durations are above the longer duration averages, implying a sound upward trend. Leidos Holdings Inc’s price action over the past 90 days can be seen via the chart below.
Want More Great Investing Ideas?
9 “MUST OWN” Growth Stocks for 2021
5 WINNING Stock Chart Patterns
7 Best ETFs for the NEXT Bull Market