The Hourly View for HCA
Currently, HCA (Get Ratings)’s price is down $-0.22 (-0.1%) from the hour prior. This is a reversal of the price action on the previous hour, in which price moved up. Regarding the trend, note that the strongest trend exists on the 50 hour timeframe. Of note is that the 200 and 50 hour changed directions on HCA; they are now pointing up. The moving averages on the hourly timeframe suggest a choppiness in price, as the 20, 50, 100 and 200 are all in a mixed alignment — meaning the trend across timeframes is inconsistent, indicating a potential opportunity for rangebound traders.
HCA ranks 12th in terms of today’s price percentage change out of Healthcare stocks.
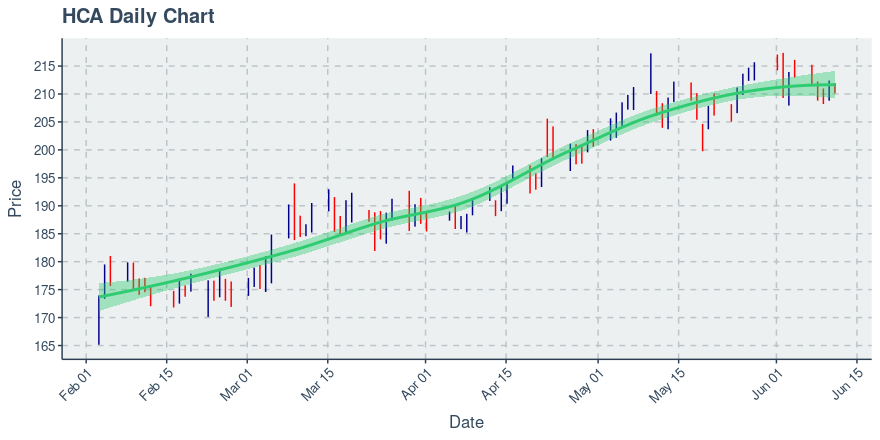
HCA’s Technical Outlook on the Daily Chart
Currently, HCA’s price is up $0.24 (0.11%) from the day prior. The daily chart shows that HCA has seen 2 straight up days. As for the trend on the daily timeframe, we see the clearest trend on the 100 day timeframe. The moving averages on the daily timeframe suggest a bullishness in price, as the 20, 50, 100 and 200 are all in a bullish alignment — meaning the shorter durations are above the longer duration averages, implying a sound upward trend. The chart below shows HCA’s price action over the past 90 days.
For HCA News Traders
Investors and traders in HCA may be particularly interested in the following story that came out in the past day:
BD’s (BDX) Milestone Pandemic Orders to Support Vaccinations
BD (BDX) receives 2 billion pandemic orders for needles and syringes to support global COVID-19 vaccination efforts.
Want More Great Investing Ideas?
9 “MUST OWN” Growth Stocks for 2021
5 WINNING Stock Chart Patterns
7 Best ETFs for the NEXT Bull Market