The Hourly View for DXC
At the time of this writing, DXC (Get Ratings)’s price is down $-0.15 (-0.36%) from the hour prior. DXC has seen its price go down 4 out of the past 5 hours, thus creating some compelling opportunities for bears. As for the trend on the hourly timeframe, we see the clearest trend on the 20 hour timeframe. The moving averages on the hourly timeframe suggest a bullishness in price, as the 20, 50, 100 and 200 are all in a bullish alignment — meaning the shorter durations are above the longer duration averages, implying a sound upward trend.
DXC ranks 232nd in terms of today’s price percentage change out of Business Services stocks.
DXC’s Technical Outlook on the Daily Chart
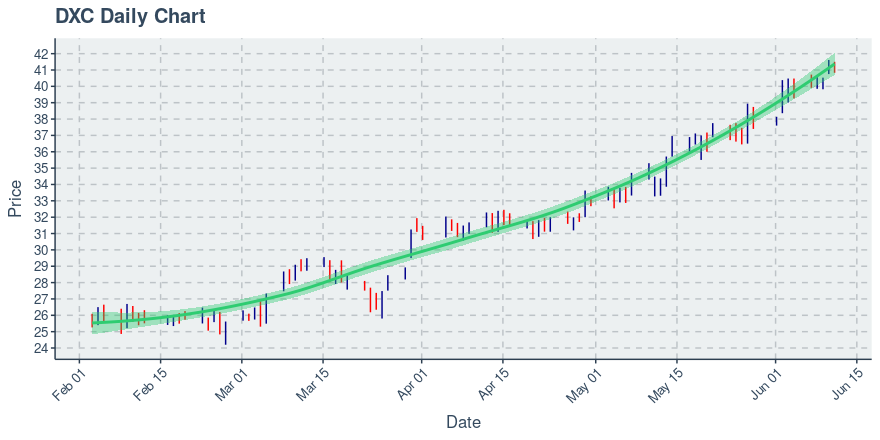
Currently, DXC’s price is down $-0.21 (-0.51%) from the day prior. This is a reversal of the price action on the previous day, in which price moved up. Regarding the trend, note that the strongest trend exists on the 20 day timeframe. The moving averages on the daily timeframe suggest a bullishness in price, as the 20, 50, 100 and 200 are all in a bullish alignment — meaning the shorter durations are above the longer duration averages, implying a sound upward trend. The chart below shows DXC’s price action over the past 90 days.
For DXC News Traders
News traders keeping an eye on DXC may find value in this recent story:
DXC Technology Welcomes Brenda Tsai as Chief Marketing and Communications Officer
DXC Technology Welcomes Brenda Tsai as Chief Marketing and Communications Officer
Want More Great Investing Ideas?
9 “MUST OWN” Growth Stocks for 2021
5 WINNING Stock Chart Patterns
7 Best ETFs for the NEXT Bull Market