The Hourly View for RRC
Currently, RRC (Get Ratings)’s price is down $-0.02 (-0.14%) from the hour prior. It’s been a feast for bulls operating on an hourly timeframe, as RRC has now gone up 4 of the past 5 hours. Regarding the trend, note that the strongest trend exists on the 50 hour timeframe. The moving averages on the hourly timeframe suggest a bullishness in price, as the 20, 50, 100 and 200 are all in a bullish alignment — meaning the shorter durations are above the longer duration averages, implying a sound upward trend.
RRC ranks 40th in terms of today’s price percentage change out of Petroleum and Natural Gas stocks.
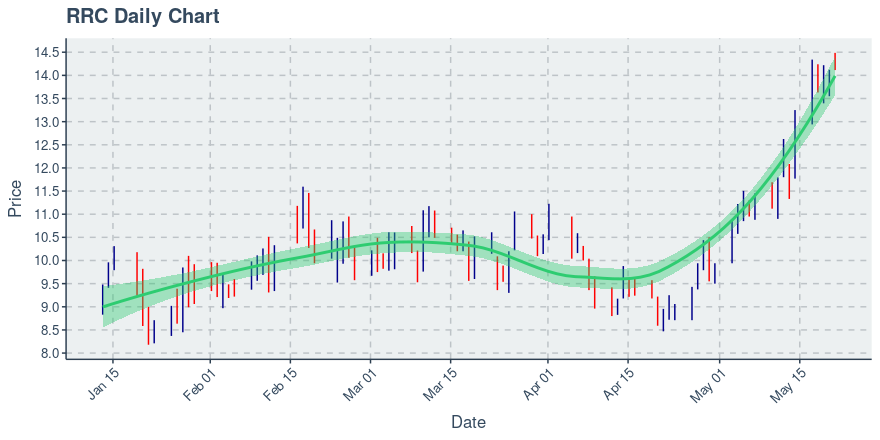
RRC’s Technical Outlook on the Daily Chart
At the moment, RRC’s price is up $0.21 (1.46%) from the day prior. This move is a reversal from the day prior, which saw price move down. If you’re a trend trader, consider that the strongest clear trend on the daily chart exists on the 100 day timeframe. The moving averages on the daily timeframe suggest a bullishness in price, as the 20, 50, 100 and 200 are all in a bullish alignment — meaning the shorter durations are above the longer duration averages, implying a sound upward trend. Range Resources Corp’s price action over the past 90 days can be seen via the chart below.
Want More Great Investing Ideas?
9 “MUST OWN” Growth Stocks for 2021
5 WINNING Stock Chart Patterns
7 Best ETFs for the NEXT Bull Market