The Hourly View for WDAY
At the moment, WDAY (Get Ratings)’s price is down $-1.57 (-0.61%) from the hour prior. It’s been a feast for bulls operating on an hourly timeframe, as WDAY has now gone up 8 of the past 10 hours. Regarding the trend, note that the strongest trend exists on the 100 hour timeframe. Of note is that the 50 hour changed directions on WDAY; it is now pointing down. The moving averages on the hourly timeframe suggest a choppiness in price, as the 20, 50, 100 and 200 are all in a mixed alignment — meaning the trend across timeframes is inconsistent, indicating a potential opportunity for rangebound traders.
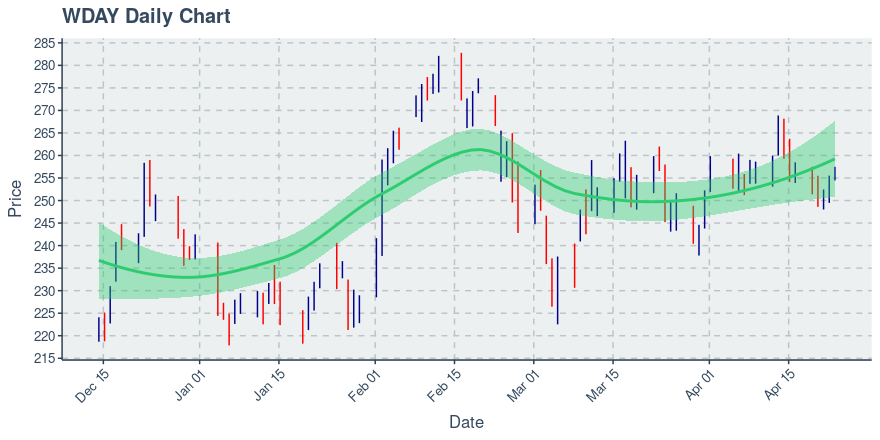
WDAY’s Technical Outlook on the Daily Chart
Currently, WDAY’s price is up $2.12 (0.84%) from the day prior. The daily chart shows that WDAY has seen 3 straight up days. Regarding the trend, note that the strongest trend exists on the 50 day timeframe. Most noteworthy in the world of moving averages on the daily chart is that the 20 and 50 day moving averages have been crossed, so that price is now turning above them. The moving averages on the daily timeframe suggest a choppiness in price, as the 20, 50, 100 and 200 are all in a mixed alignment — meaning the trend across timeframes is inconsistent, indicating a potential opportunity for rangebound traders. The chart below shows WDAY’s price action over the past 90 days.
Want More Great Investing Ideas?
9 “MUST OWN” Growth Stocks for 2021
5 WINNING Stock Chart Patterns
7 Best ETFs for the NEXT Bull Market