
It’s been a busy past month for major asset classes, and while Q4 was mostly a quarter to forget, both gold (GLD) and silver (SLV) managed to finish the year strong.
This was a significant positive development because gold had a pivot of $1,700/oz to confirm its yearly breakout, and this level was briefly under pressure during the depths of the correction during Q4. Fortunately, the close well above this pivot level has further increased the probability that we are in a new bull market, and the first all-time high in a new bull market is rarely the last. This suggests that we are likely still in the early innings of a new precious metals bull market, and this will remain the case as long as gold remains above $1,700/oz on a yearly closing basis. Let’s take a closer look below:
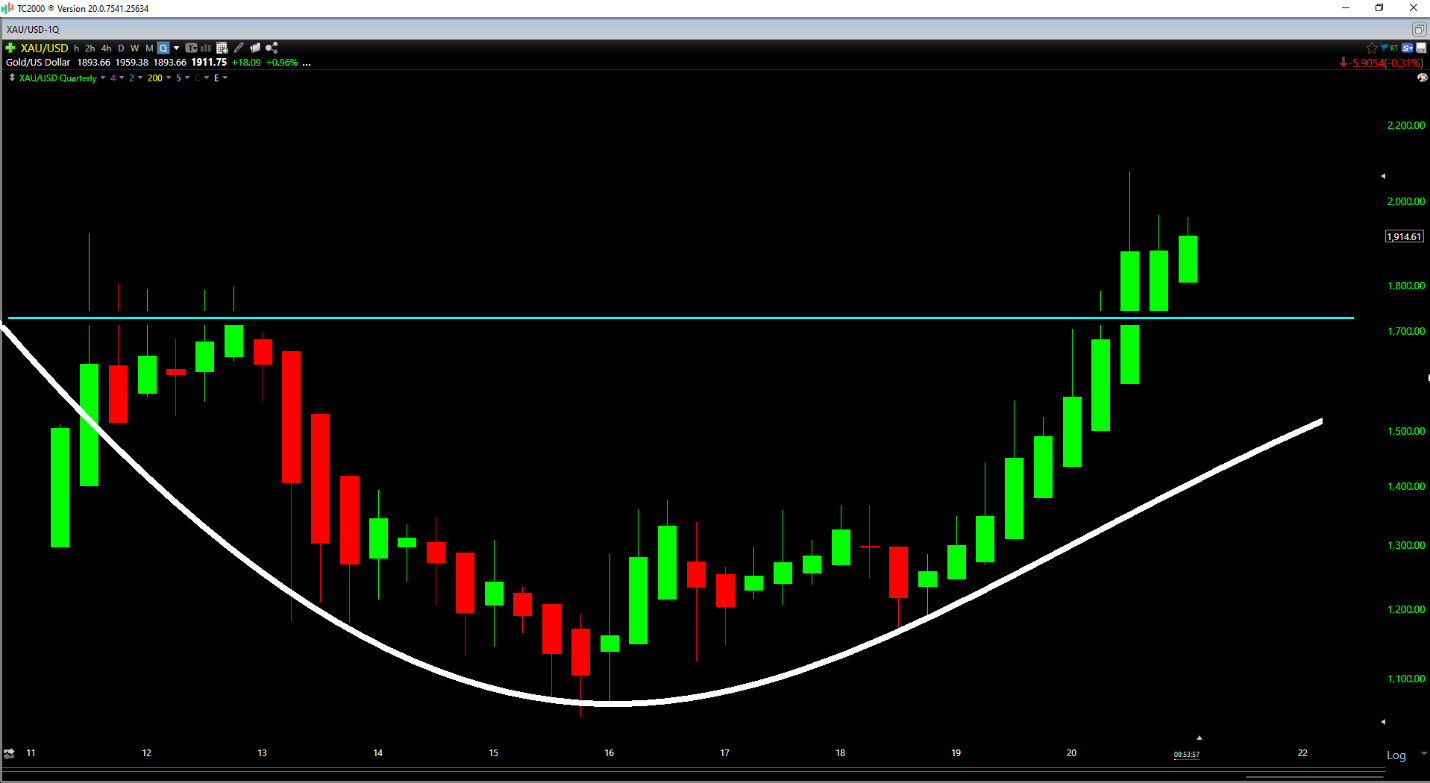
(Source: TC2000.com)
As shown in the chart above, the yellow metal has gone nowhere for nearly a decade following a gruesome bear market in 2012 through 2015, which nearly cut the metal in half.
However, we finally saw a range expansion, which was confirmed with the yearly close above $1,700/oz in 2020, translating to a new all-time high yearly close for the metal. Many critics seem to have jumped in the bear camp for gold, and continue to point out that gold miners (GDX) are terrible investments simply due to past biases and more than a decade of poor returns. However, the same was said about many asset classes in the past, and every asset class has its decade of under-performance.
The great thing about these ‘lost’ decades is that they grind down bullish sentiment to a pulp so that when new highs finally do show up, most of the public isn’t interested. Let’s look at a few examples below:
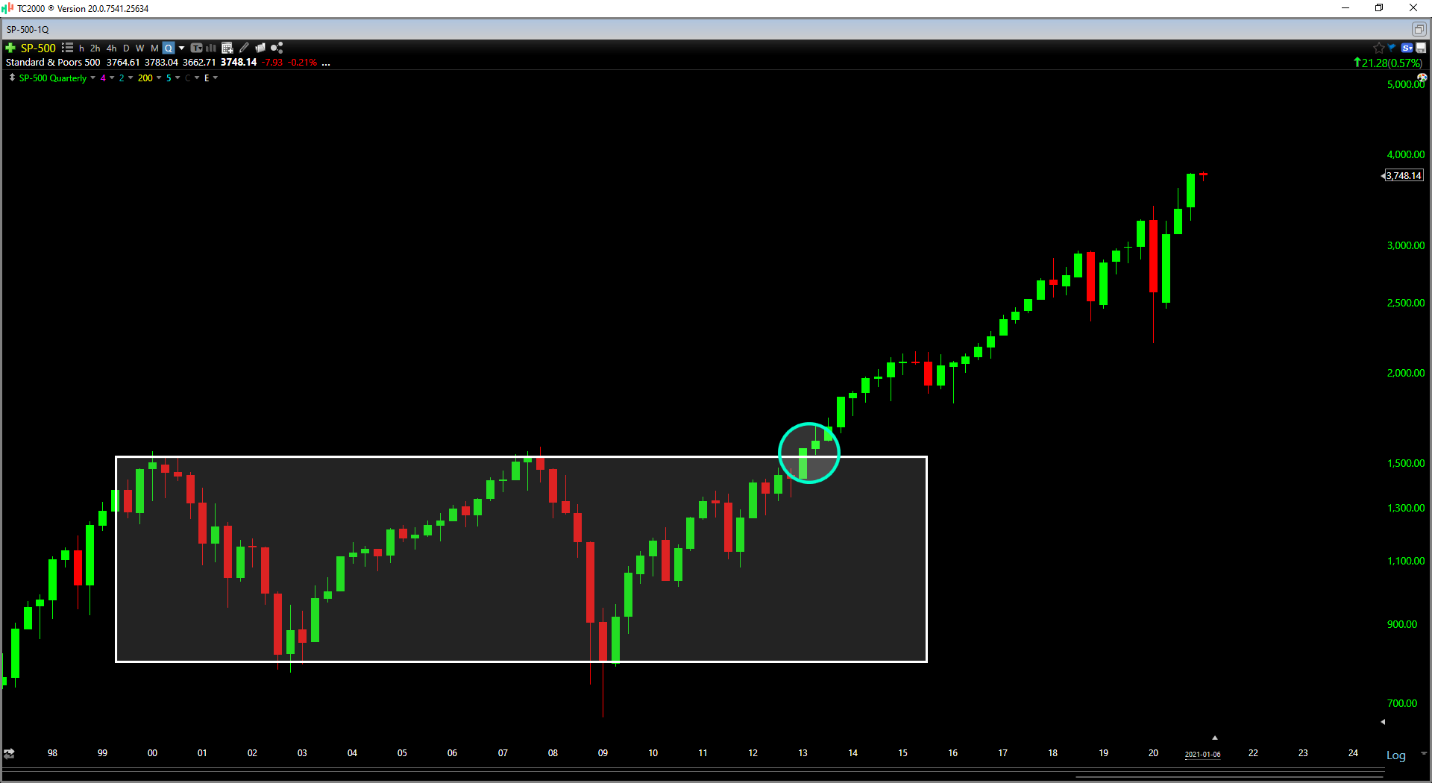
(Source: TC2000.com)
As shown in the chart above, the S&P-500 (SPY) had a lost decade between 2001 and 2012, with the market going nowhere and suffering two major secular bull markets. When the market finally broke out in 2013, many had proclaimed that this was simply a triple-top and a test of a major resistance level, and this was the wrong time to be piling into the market.
However, as the chart shows above, this was actually the top of the 1st inning of a new secular bull market, which would see the SPX gain 100% over the next six years. While this might not seem like much, this 100% return for the S&P-500 translated to a more than 1000% return for several leading stocks in the same period.
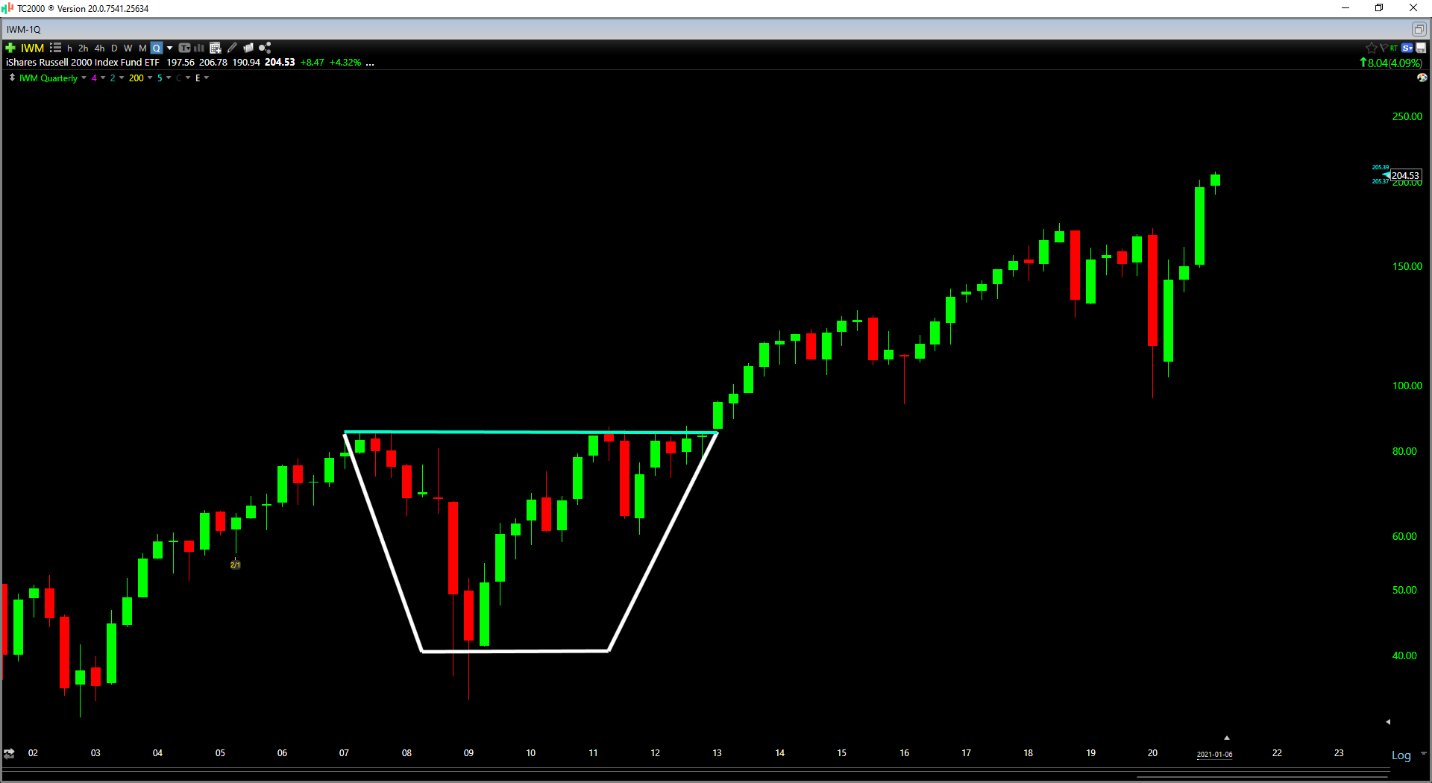
(Source: TC2000.com)
We heard similar arguments in 2012 for the Russell 2000 (IWM), with the index being one of the hardest-hit indexes during the 2007-2009 bear market, plunging 60% from its highs. However, the all-time high in late 2012 was a very bullish signal for the index, suggesting that the landscape was finally changing, and discussions of how poor the historical 10-year return was at the time were irrelevant.
It’s important to note that while these arguments for poor long-term performance do hold weight until an index proves itself and makes a new all-time high, they hold zero weight once that new all-time high is made and confirmed by a yearly close. This is because there is clearly a positive change in the fundamentals to bring on this new all-time high. This typically shows up in price action first, with the smart money looking forward to either a brighter economy or a brighter fundamental outlook.
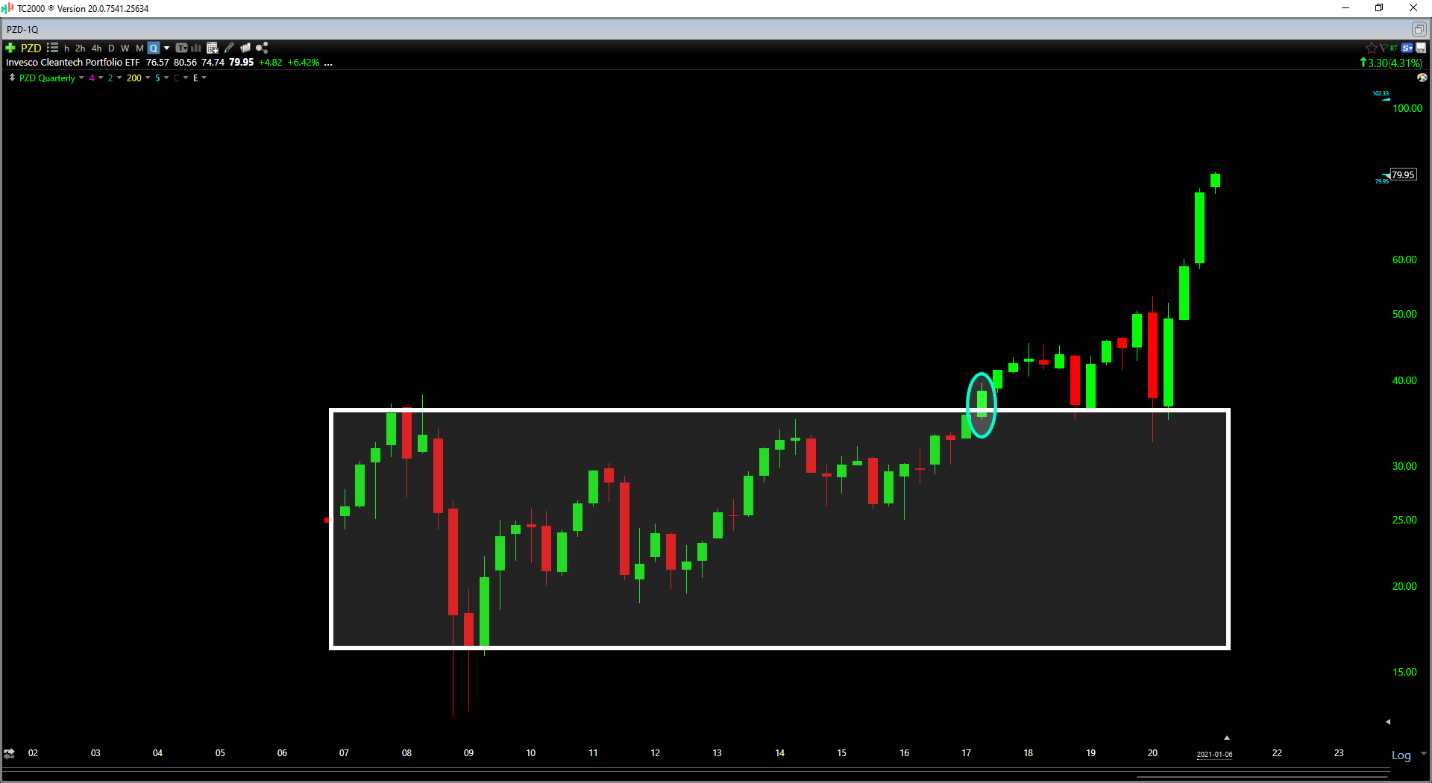
(Source: TC2000.com)
Three years ago, it was difficult to get anyone to discuss clean energy positively, and many were still on the oil bandwagon (USO) despite a devastating bear market in 2014 through 2016. However, the Cleantech Portfolio ETF (PBW) broke to new all-time highs after doing nothing since its inception and rose an incredible 100% in less than three years. This all-time high was signaling a positive change in the fundamentals and the fact that it was time to be open-minded to beginning to start positions in this area.
(Source: TC2000.com)
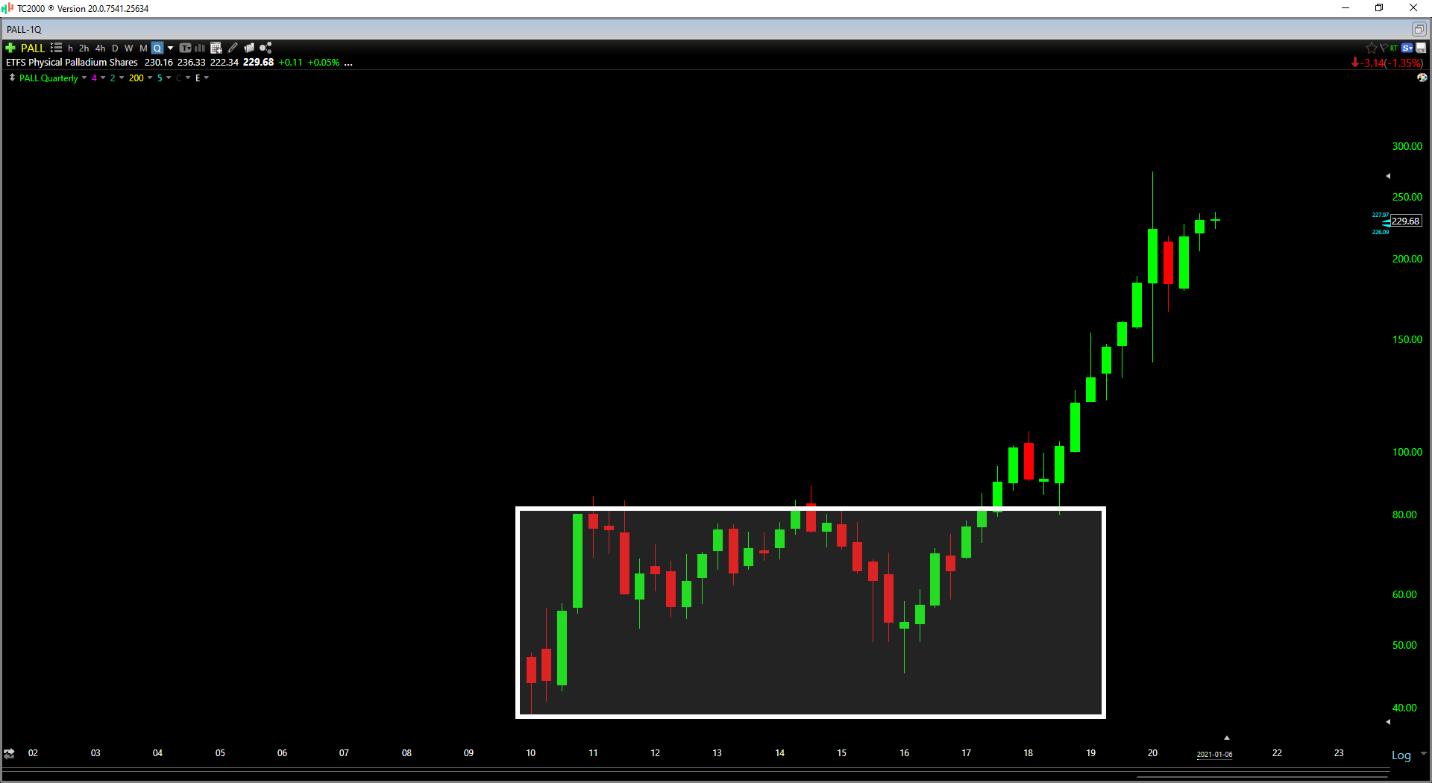
The last example worth noting is palladium (PALL), gold’s more expensive cousin, that broke out of a massive decade-long base in 2017. As shown above, the metals tend to see super-charged returns when they break out of these massive bases, and the Palladium ETF was no exception.
In fact, the metal soared 250% in less than three years from its breakout, and the worst possible thing to do at this all-time high was to be skittish or bearish. Just because an asset class has had a difficult time with a level in the past or has a poor 10-year return is zero reasons to be negative on it. Still, many generalist investors continue to poo-poo gold due to recency bias.
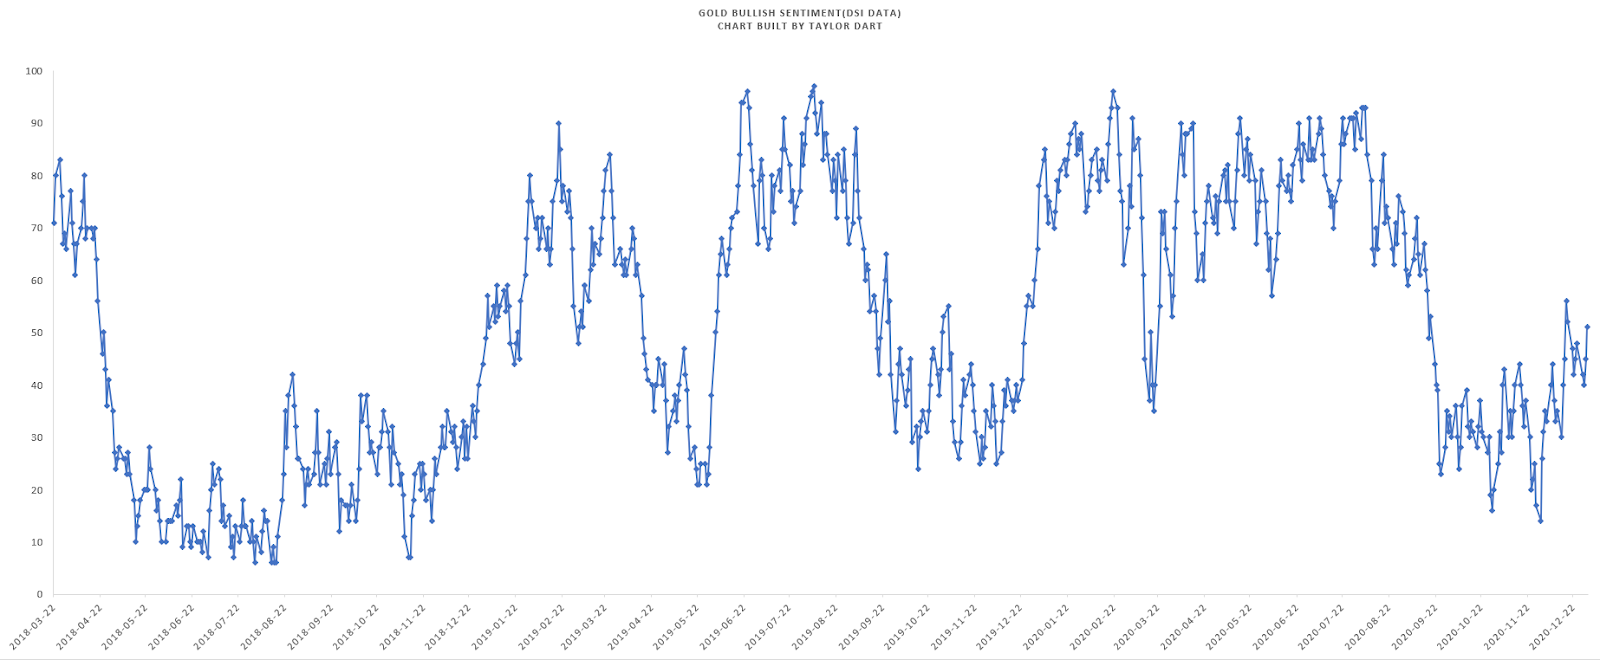
(Source: Daily Sentiment Index Data, Author’s Chart)
As should be clear from the above examples, all-time highs from near decade-long consolidations are very bullish, and gold’s breakout last year achieved precisely this feat. The fact that bullish sentiment remains at barely 50% despite this massive breakout is a gift for investors because it suggests that only a small group of investors are actually bullish on the metal.
While sentiment did soar to 90% bulls in August when the trade was crowded, the 15% correction in the metal has wiped out much of this bullish sentiment. Meanwhile, given that gold is less than 10% above its previous all-time high, and all the above examples achieved a 100% return within six years, we can confirm that gold likely has quite a bit of gas left in its tank long-term.
Obviously, there’s no guarantee that gold performs similarly to the examples above, with the average return from the all-time high breakout over the first three years being above 75%. Even if we are conservative and cut the average return within three years from the breakout in half, we come up with an average return of 37% between now and August 2023.
This would translate to a gold price near $2,650/oz, and margins for major gold miners above 60% based on average all-in sustaining costs of $1,000/oz. This would translate to a 200 basis-point improvement from current levels, with most mining companies currently working with average margins of 40%. Therefore, there’s a case to be made for both miners and gold in a portfolio with the new all-time high breakout recently confirmed.
While it’s never that easy to buy all-time highs, the above charts should provide comfort that all-time highs are actually quite bullish, with assets rarely re-entering their base after multi-year breakouts. Given the recent breakout through $1,900/oz, the initial price target for this breakout is $2,350/oz, with a potential for $2,700/oz by 2023 if the $2,350/oz target is met. Based on this enormous upside based on conservative technical targets, I remain bullish for gold even after last year’s sharp increase. I believe that this is similar to the rare opportunity the S&P-500 offered in 2013 to get long at a major breakout area.
Given the metal’s long-term bullish outlook, I would view any pullbacks below $1,850/oz as opportunities to add to one’s position, and I continue to see a case for accumulating best in breed gold miners like Kirkland Lake Gold (KL) and Newmont (NEM).
Disclosure: I am long GLD, NEM, KL
Disclaimer: Taylor Dart is not a Registered Investment Advisor or Financial Planner. This writing is for informational purposes only. It does not constitute an offer to sell, a solicitation to buy, or a recommendation regarding any securities transaction. The information contained in this writing should not be construed as financial or investment advice on any subject matter. Taylor Dart expressly disclaims all liability in respect to actions taken based on any or all of the information on this writing.
Want More Great Investing Ideas?
9 “MUST OWN” Growth Stocks for 2021
Should Investors Beware January 6?
7 Best ETFs for the Next Bull Market
The SPDR Gold Shares (GLD) was trading at $179.49 per share on Thursday afternoon, down $0.41 (-0.23%). Year-to-date, GLD has gained 0.63%, versus a 1.27% rise in the benchmark S&P 500 index during the same period.
GLD currently has an ETF Daily News SMART Grade of B (Buy), and is ranked #10 of 35 ETFs in the Precious Metals ETFs category.
About the Author: Taylor Dart
 Taylor has over a decade of investing experience, with a special focus on the precious metals sector. In addition to working with ETFDailyNews, he is a prominent writer on Seeking Alpha. Learn more about Taylor’s background, along with links to his most recent articles. More…