
It’s been a rough couple of months for the precious metals space, and while silver (SLV) managed to hold its August lows leading into Thanksgiving, gold (GLD) has come crashing down through the $1,860/oz level.
This sharp decrease on the back of three months of technical weakness has left the metal more than 13% off its highs, which is just below the 15% correction in March. Some investors have proclaimed the bull market is now over following the sharp decline we’ve seen.
However, it’s important to note that pullbacks of this magnitude are entirely normal, even in a bull market, with the metal enduring a 17% correction in 2016 and a 14% correction in 2018. This correction currently resembles the prior two almost identically, with a dearth of bullish sentiment, complete carnage in the miner space, and a pullback to at or below gold’s 200-day moving average.
Therefore, instead of panicking, one should be open-minded to the fact that the worst is likely over. Let’s take a closer look below:
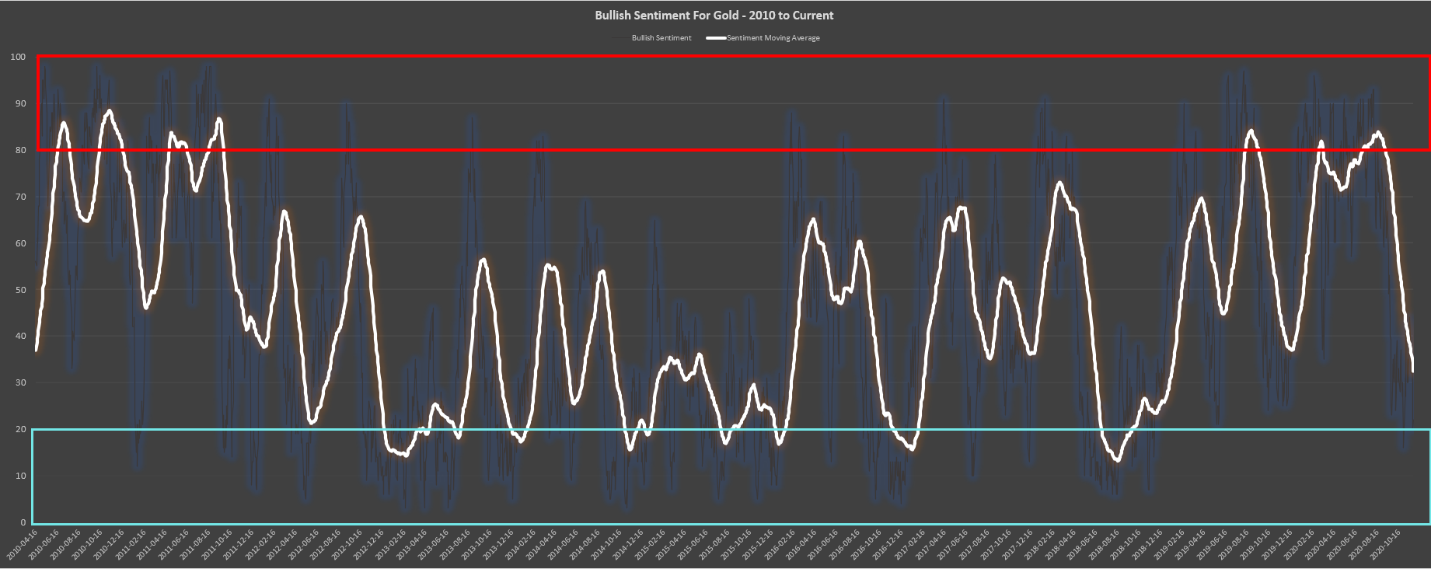
(Source: Daily Sentiment Index Data, Author’s Chart)
Beginning with the sentiment, we can see that bullish sentiment has come a long way from August levels, with the long-term moving average dropping from 85% bulls to 30% bulls. This means that we had 8.5 market participants for every 10 bullish in August, and we’re now down to just 3 out of every 10 investors bullish. This is quite strange given that gold is actually up 19% for the year and outperforming the S&P-500 (SPY) and more than 85% of other ETFs. It’s even more perplexing given that gold made a new all-time high this year.
While the metal still has further to reach its low-risk buy zone, I would expect to hit this area before year-end as long as gold stays below $1,900/oz. Therefore, the best thing for investors here is further weakness or limited upside progress for another week or two, as this should come close to generating a buy signal.
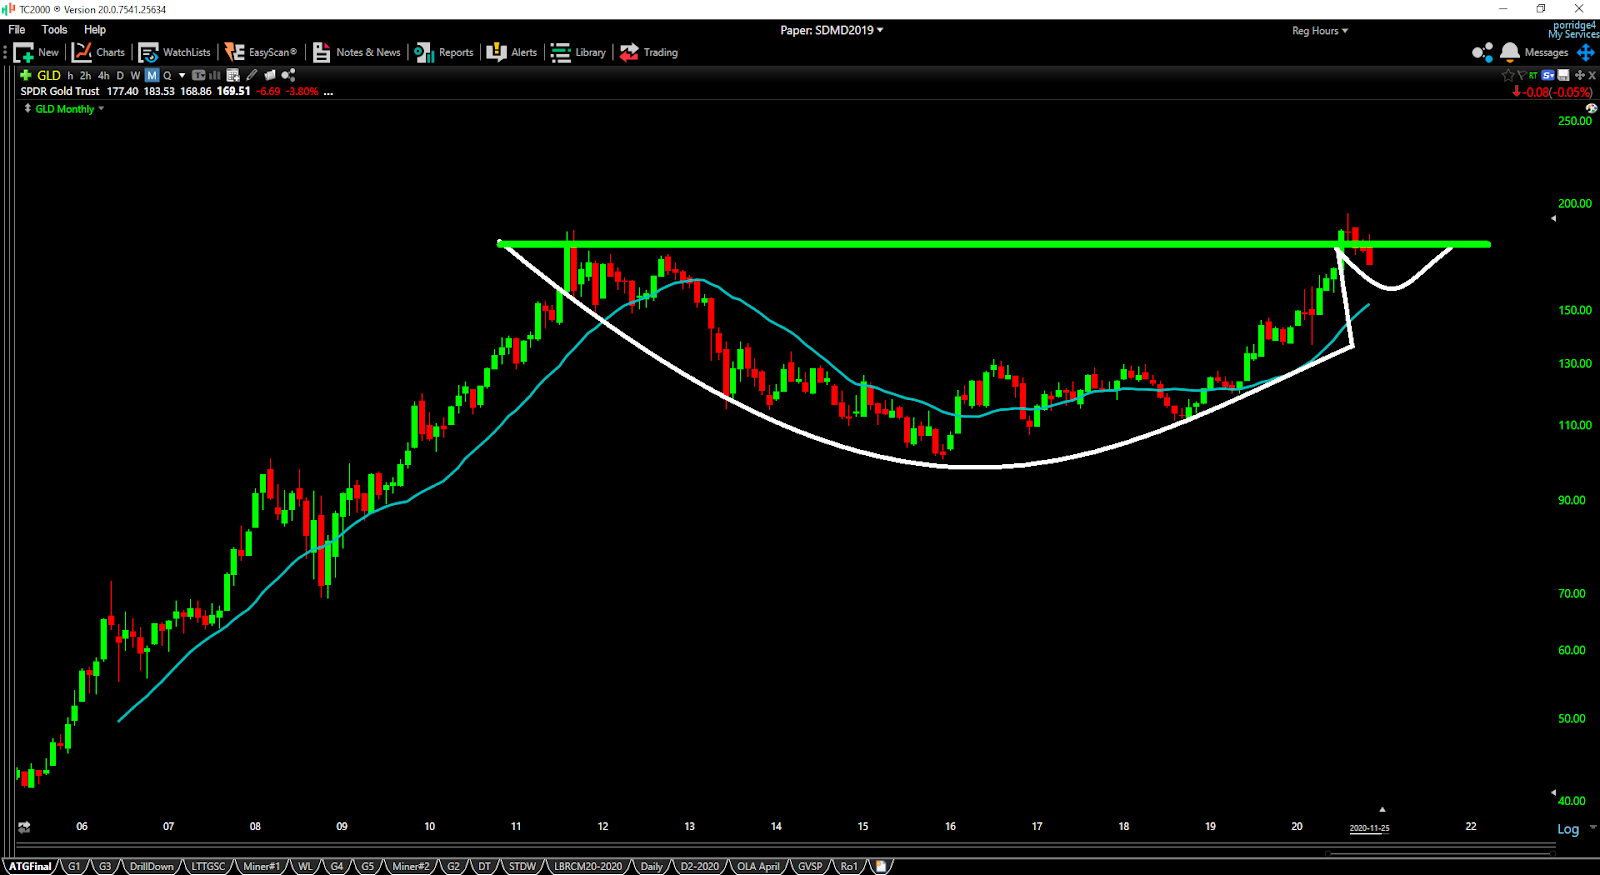
(Source: TC2000.com)
If we look at the long-term picture, there’s really nothing to be worried about, as the metal is sitting above its monthly moving average (teal line) and just below a new all-time high breakout. Typically, pullbacks have found strong support at the monthly moving average in past bull markets, as we saw in 2006, 2007, 2008, and before the meltdown in 2012. We are currently sitting above a rising monthly moving average, with this area coming in near $1,700/oz.
It also looks like we’re carving out a handle to this decade-long cup-shaped base, a very bullish development. Obviously, there’s no guarantee that this handle ends up forming and that we don’t retrace further, but the first test of a monthly moving average in a new bull market is almost always a buying opportunity. Therefore, I don’t see a single reason to be bearish here.
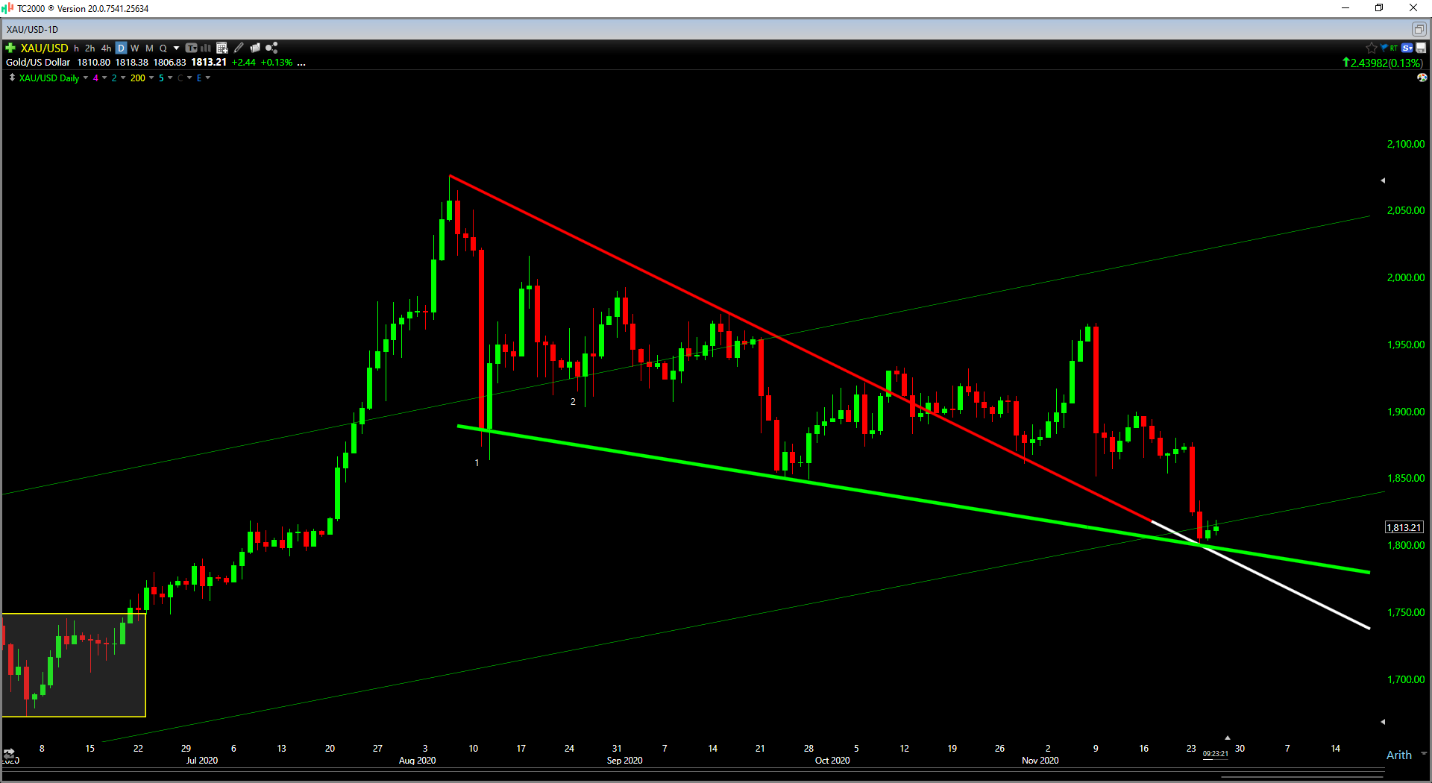
(Source: TC2000.com)
If we zoom in on the shorter-term picture, we’ve got a very messy correction on our hands, but gold is sitting right at its lower wedge support and also re-testing the downtrend line it broke out of in mid-October.
This is a logical spot for the metal to find some support, but the bounce’s strength should tell us whether the lows are finally in. If we can see a strong bounce and a thrust back above $1,860/oz on a weekly close, I would argue that there’s a high probability the correction has run its course. However, as long as we remain below $1,860/oz, a drop to $1,775/oz is on the table – with this being the prior resistance in Q2.
So, what’s the best course of action?
While the metal might still have another couple of weeks] to go in this correction, I believe the worst is over.
Therefore, I see this as an opportune time to start nibbling on some of the best miners with the most attractive valuations, with two of these being Kirkland Lake Gold (KL) and Newmont Corporation (NEM). These two companies are currently paying 2% annual dividend yields and trading below 12x FY2021 annual EPS estimates, a compelling valuation for companies that are expected to grow annual EPS by over 30% next year.
When it comes to gold, I have not added to my position yet, but I continue to remain long from $1,450/oz last year. If we were to see a drop below $1,760/oz, I would look to increase my exposure. For now, the jury is out on whether the low is in, but a recovery back above $1,860/oz would be a bullish development.
Disclosure: I am long KL, NEM, GLD
Disclaimer: Taylor Dart is not a Registered Investment Advisor or Financial Planner. This writing is for informational purposes only. It does not constitute an offer to sell, a solicitation to buy, or a recommendation regarding any securities transaction. The information contained in this writing should not be construed as financial or investment advice on any subject matter. Taylor Dart expressly disclaims all liability in respect to actions taken based on any or all of the information on this writing.
Want More Great Investing Ideas?
9 “MUST OWN” Growth Stocks for 2021
Investors: We Have Much to Be Thankful For! (Market outlook and trading strategy plan from Steve Reitmeister)
5 WINNING Stocks Chart Patterns
The SPDR Gold Shares (GLD) was trading at $167.01 per share on Friday morning, down $2.50 (-1.47%). Year-to-date, GLD has gained 16.87%, versus a 14.67% rise in the benchmark S&P 500 index during the same period.
GLD currently has an ETF Daily News SMART Grade of C (Neutral), and is ranked #14 of 34 ETFs in the Precious Metals ETFs category.
About the Author: Taylor Dart
 Taylor has over a decade of investing experience, with a special focus on the precious metals sector. In addition to working with ETFDailyNews, he is a prominent writer on Seeking Alpha. Learn more about Taylor’s background, along with links to his most recent articles. More…