

It’s been a frustrating couple of months for the price of gold (GLD) as the S&P-500 (SPY) has received most of the attention, hitting new highs following the election while gold took another leg down. However, while the recent weakness continues to grind down the bulls’ confidence, it’s worth noting that we’ve still seen no real technical damage done to the big picture.
In fact, gold still remains above its previous record quarterly close, yet bullish sentiment continues to waver. This weakness is creating an opportunity for investors to begin to start positions in the best miners in the sector, especially considering that yields in the sector are 30% higher than when this correction began. Let’s take a closer look below:
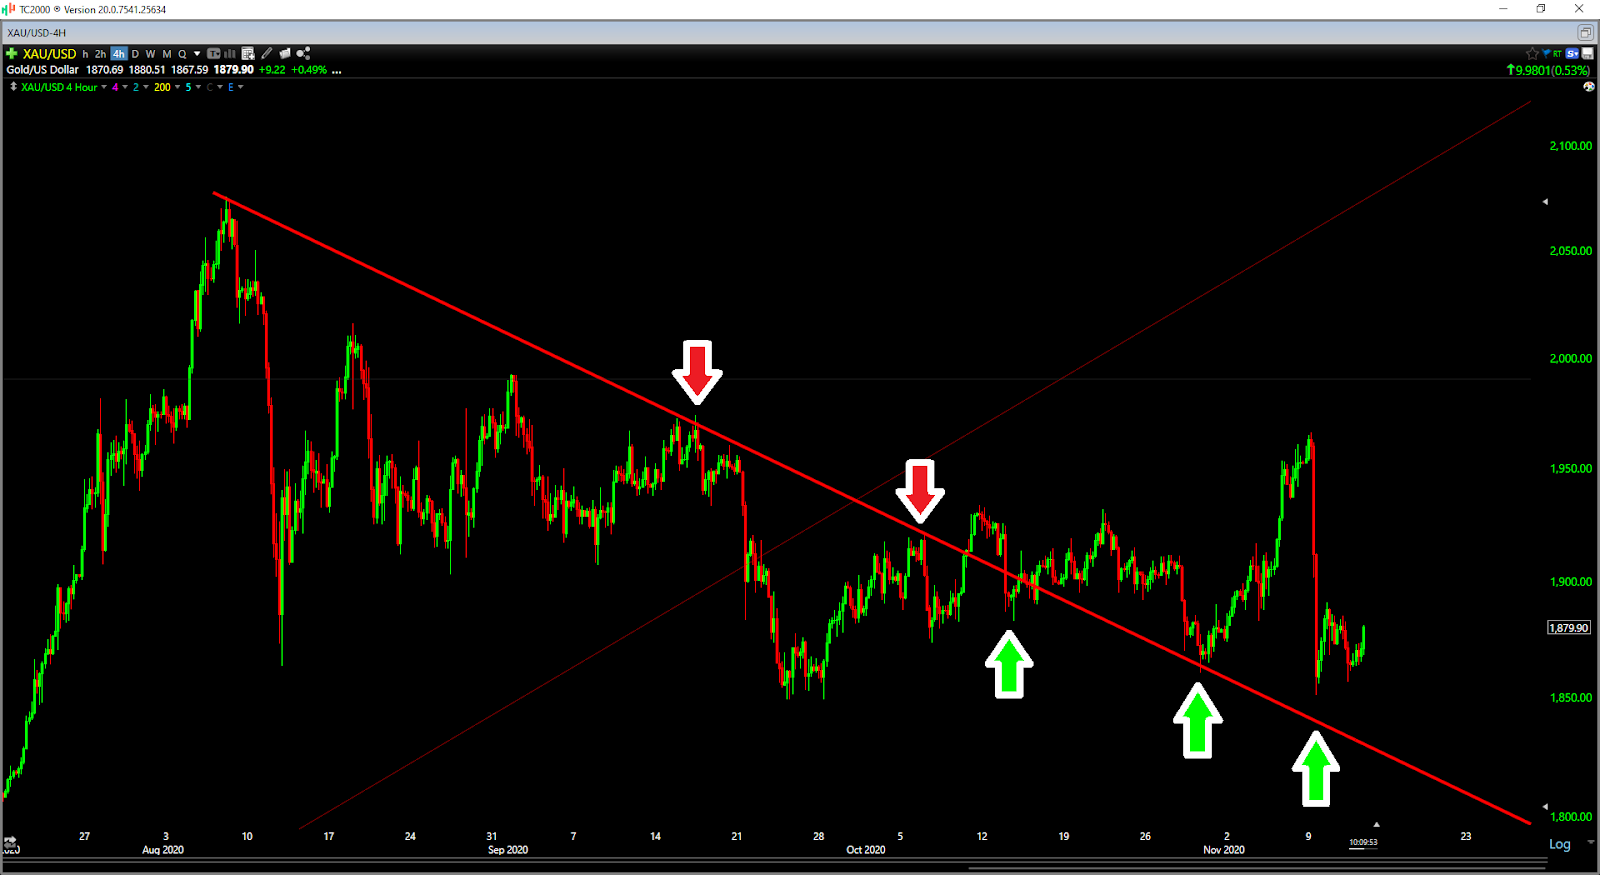
(Source: TC2000.com)
If we look at the above daily chart of gold, we can see that the waterfall decline last week was certainly not pretty, but it didn’t put any real dent in the technical picture. This is because the metal continues to trade above its short-term downtrend, and we’ve already seen a slight change of character from August and September.
This is because the metal was previously running into its downtrend line and making lower lows, but since mid-October, the metal has been holding the line at $1,860/oz and finding support on any re-tests of its broken downtrend line. This is a bullish development as long as it holds, so the key for the bulls from now on will be defending $1,830/oz at all costs.
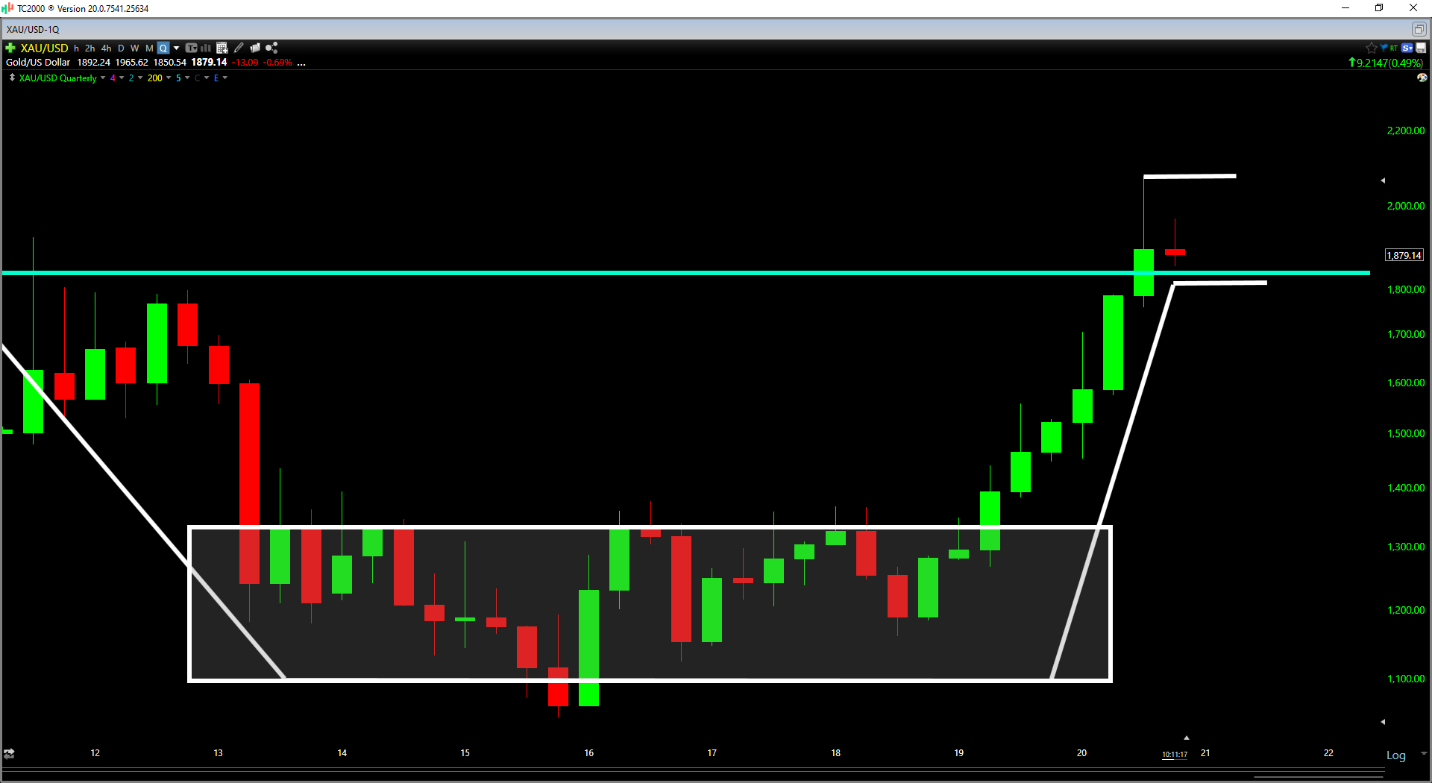
(Source: TC2000.com)
If we move over to the big picture for gold, we can see that this whole correction has not even registered as a blip on the long-term chart. As shown above, gold put in a new all-time quarterly high close near $1,900/oz in Q3 and remains above its long-term breakout level of $1,800/oz. The previous record quarterly close for the metal and long-term pivot also comes in at $1,780/oz, and we’re above this level as well.
Therefore, while the recent correction might be concerning to those zoomed in on 2-hour and 4-hour charts, the quarterly chart shows that this whole correction has occurred in new record-high territory for the metal, and there’s no reason to consider this breakout in jeopardy at all. This does not mean that the metal can’t fail and that this breakout is guaranteed to hold, but as long as the metal stays above $1,775/oz, I would view the big picture as bullish.
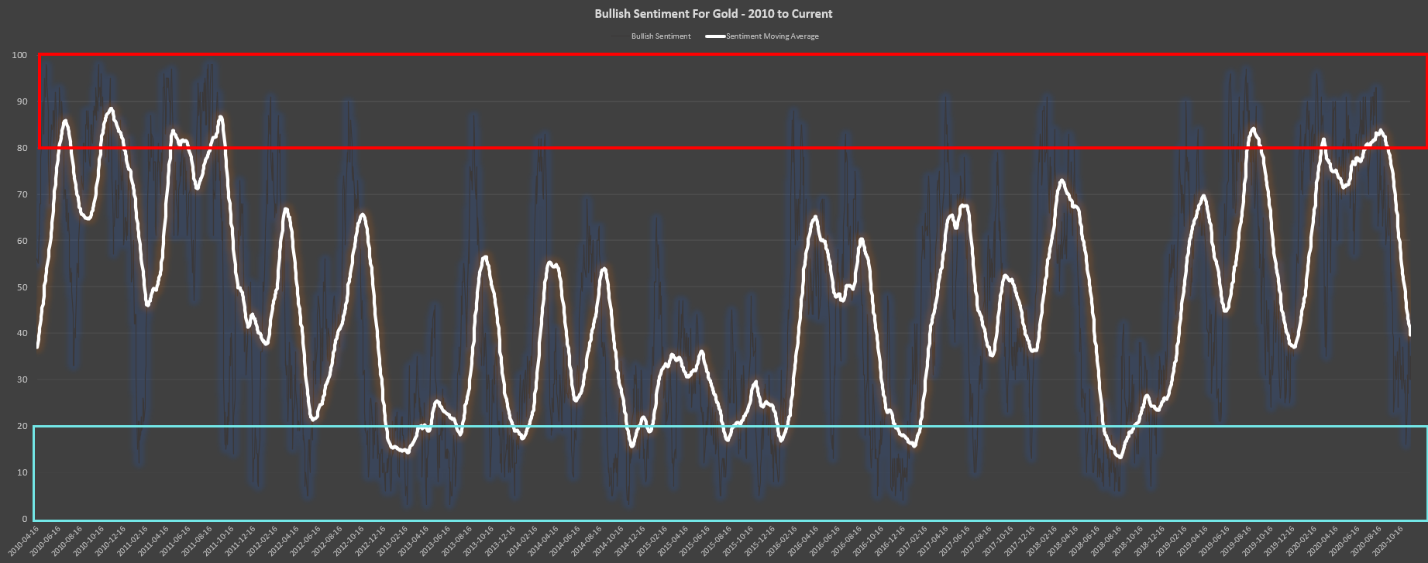
(Source: Daily Sentiment Index Data, Author’s Chart)
While the proof that the technical picture remains intact is great, the most encouraging sign is the fact that market participants are becoming extremely pessimistic for no reason. As the chart above shows, the long-term moving average for sentiment has slid from 85% bulls to 40% bulls despite a run-of-the-mill 12% correction in the metal. Meanwhile, daily sentiment readings have slipped to below 20%, suggesting four bears for every one bull in the market.
It is quite rare for us to see this much pessimism despite a very normal correction and following a breakout to new all-time highs. Therefore, I would argue that sentiment is finally becoming a tailwind for the metal, and any further dips towards $1,840/oz are likely to get bought up.
So, what’s the best course of action?
While I have not added to my gold position yet that I continue to hold from $1,450~/oz, I would consider adding if the metal dips below $1,820/oz. For now, I continue to focus on miners that are increasing dividends and have 50% plus gross margins like Kirkland Lake Gold (KL) and B2Gold (BTG). These two names have been sold off despite posting record quarters in Q3, and both names are currently playing 2.0%+ dividend yields.
Given that the miners have much better leverage to the metal, I see this as the lowest-risk way to play the sector, especially since both names are more than 20% below their all-time highs. Therefore, for investors looking for exposure to the sector, I believe Kirkland Lake (KL), and B2Gold are two areas to put on their shopping list if we see any weakness.
Disclosure: I am long KL, BTG, GLD
Disclaimer: Taylor Dart is not a Registered Investment Advisor or Financial Planner. This writing is for informational purposes only. It does not constitute an offer to sell, a solicitation to buy, or a recommendation regarding any securities transaction. The information contained in this writing should not be construed as financial or investment advice on any subject matter. Taylor Dart expressly disclaims all liability in respect to actions taken based on any or all of the information on this writing.
Want More Great Investing Ideas?
9 “MUST OWN” Growth Stocks for 2021
Is the Bull Market Back on Track?
5 WINNING Stocks Chart Patterns
The SPDR Gold Shares (GLD) was trading at $176.31 per share on Thursday morning, up $1.41 (+0.81%). Year-to-date, GLD has gained 23.38%, versus a 11.89% rise in the benchmark S&P 500 index during the same period.
GLD currently has an ETF Daily News SMART Grade of B (Buy), and is ranked #2 of 34 ETFs in the Precious Metals ETFs category.
About the Author: Taylor Dart
 Taylor has over a decade of investing experience, with a special focus on the precious metals sector. In addition to working with ETFDailyNews, he is a prominent writer on Seeking Alpha. Learn more about Taylor’s background, along with links to his most recent articles. More…