

It’s been a frustrating month for investors in the silver (SLV) market as we saw the commodity plunge 20% just as all of the metals bugs were busy hiking their year-end forecasts to $50.00/oz silver.
While many of these price targets could be achievable long-term for the metal, the last time you want to see these targets is after a parabolic rally, as it typically suggests that everyone is now wildly bullish on the metal. This was confirmed by the fact that silver went onto a sentiment sell signal in early August, and it remains on a sell signal as of Wednesday’s close.
Fortunately, the good news is that the silver to gold ratio remains on a bullish stance, and silver looks to be consolidating above its recent multi-year breakout, a completely normal reaction after a parabolic rally. Let’s take a closer look below:
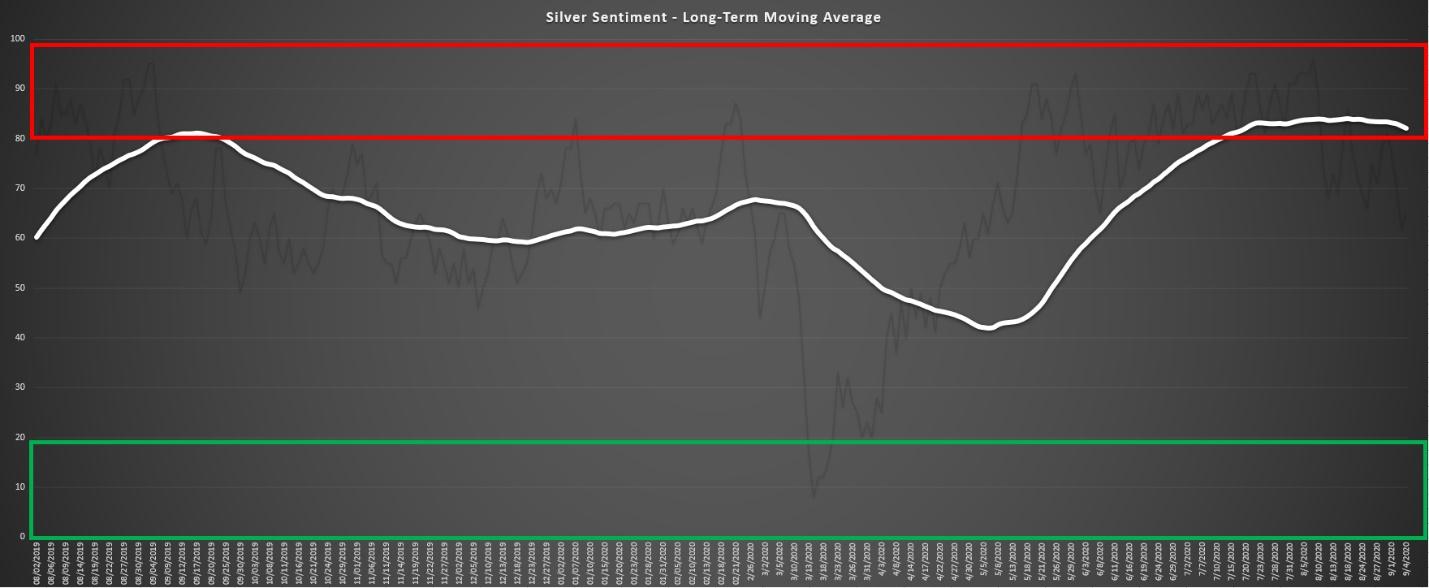
(Source: Daily Sentiment Index Data, Author’s Chart)
One of the reasons I’ve been neutral to bearish on SLV since early August has been sentiment, as sentiment ultimately rules in the short-term when it comes to markets.
As we entered the month of August, we had several days with bullish sentiment sitting above 95% bulls, and we had the long-term moving average for bullish sentiment entering the danger zone (red box) above. While we remain in this danger zone as of Wednesday’s close, we are trending in the right direction, with silver sentiment dropping to 60% bulls last week.
While this does not suggest a low is in, it is a step in the right direction. Preferably I would like to see silver sentiment fall beneath 40% for a day or two to suggest that speculators are capitulating and giving up their positions, but this is a step in the right direction for the time being.

(Source: TC2000.com)
However, while sentiment continues to be a minor headwind here for silver, the monthly chart is the most bullish it’s looked since early 2011 with a massive multi-year breakout occurring in July. Generally, the stronger a breakout is, the more weight it holds, and the fact that silver exploded out of its base suggests a high probability that this is a real move.
The other piece of good news is that this correction has been very normal to date, with no retracement anywhere near the breakout level of $22.00/oz~ thus far. Based on the current correction, the most likely path looks to be a new base built between $23.00/oz – $29.00/oz, and a possible breakout later this year.
However, if the metal does break down, I would expect the breakout area near $22.00/oz to provide support. Therefore, regardless of how this correction shakes out, I remain bullish long-term as long as $22.00/oz is defended.
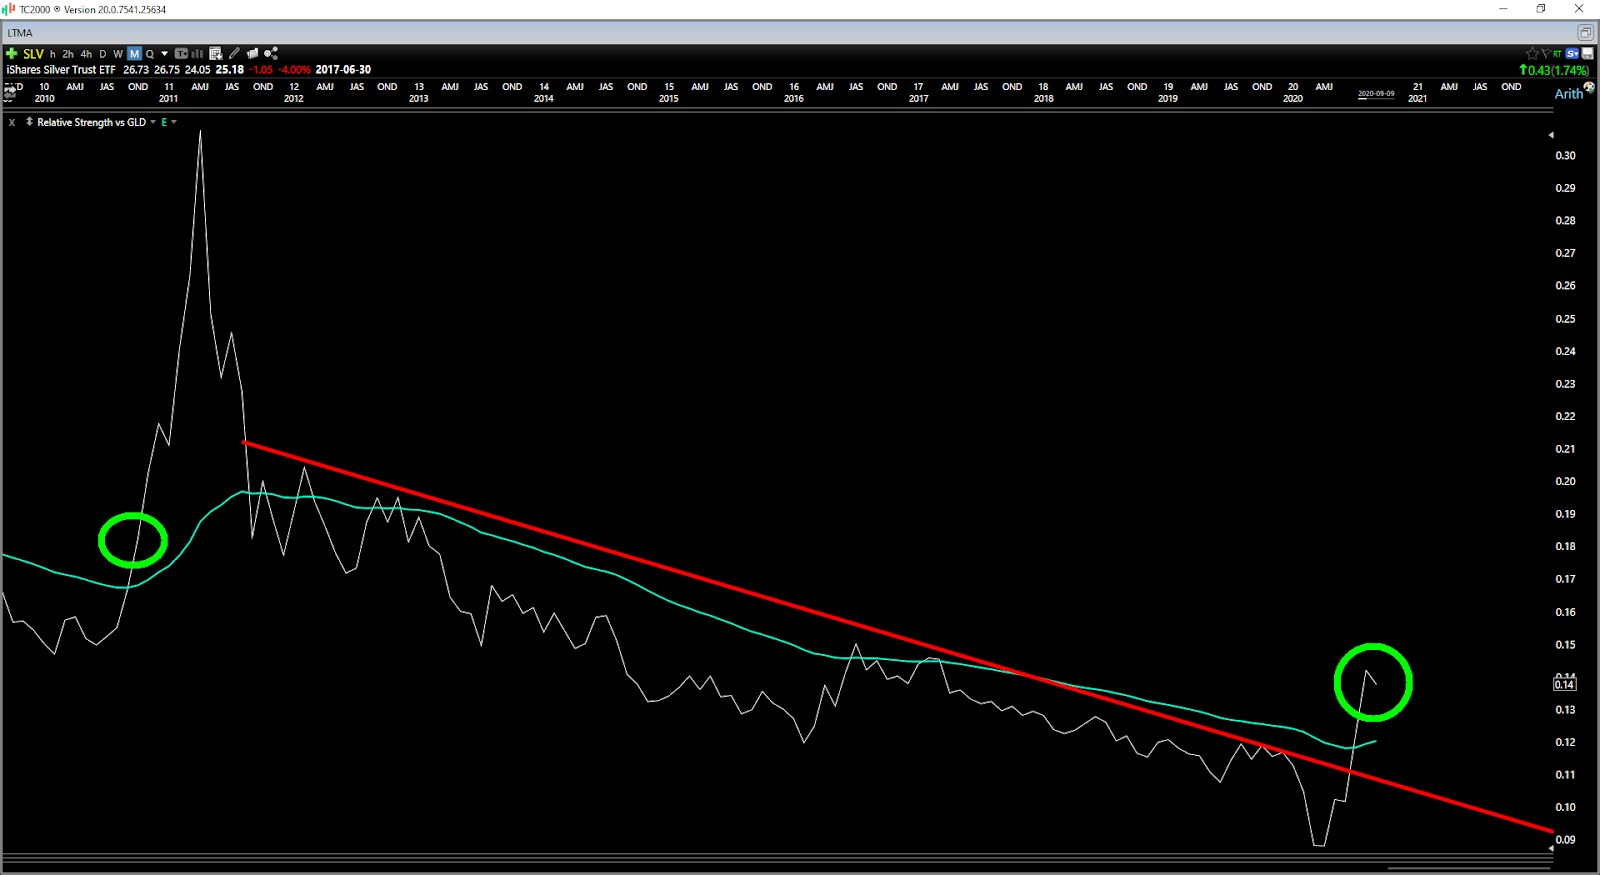
(Source: TC2000.com)
The other indicator that corroborates this view is the SLV to GLD ratio, which is back above its long-term moving average last month and has also broken its downtrend line.
The last time this occurred was late in 2010, and silver promptly doubled over the next year after reclaiming this moving average. If this were to play out similarly, we would see a move to $38.00/oz silver based on silver. This is not a prediction, and it’s based on a small sample size, so it should be taken with a grain of salt. However, this is certainly possible within 12 months, with both the monthly chart and the silver/gold ratio on a bullish stance.
So, what’s the best course of action here?
While I am not long silver as I am on the fence about how this correction unfolds, I do believe that we saw the worst of the correction with the drop last month to the $24.00/oz level. However, while we have seen the worst from a price standpoint, we may need more of a correction from a time standpoint to shake out more weak hands.
This would allow bullish sentiment to reset and exit the danger zone, and it would provide fuel for another leg higher with some bulls moving to the sidelines. Given that I’m unsure how this correction plays out for silver, I am focusing on silver miners instead and added new positions in Pan American Silver (PAAS) PAAS and Fortuna Silver Mines (FSM) last week.
These two silver miners have some of the strongest earnings growth rates in the sector and should perform well regardless of where silver goes. As long as silver stays above $22.00/oz on a monthly close, I will maintain my bullish long-term view.
Disclosure: I am long PAAS, FSM
Disclaimer: Taylor Dart is not a Registered Investment Advisor or Financial Planner. This writing is for informational purposes only. It does not constitute an offer to sell, a solicitation to buy, or a recommendation regarding any securities transaction. The information contained in this writing should not be construed as financial or investment advice on any subject matter. Taylor Dart expressly disclaims all liability in respect to actions taken based on any or all of the information on this writing.
Want More Great Investing Ideas?
7 Best ETFs for the NEXT Bull Market
Will Stocks Fall into Historical September Slump?
9 “BUY THE DIP” Growth Stocks for 2020
The iShares Silver Trust (SLV) was trading at $25.19 per share on Thursday afternoon, up $0.01 (+0.04%). Year-to-date, SLV has gained 51.02%, versus a 6.35% rise in the benchmark S&P 500 index during the same period.
SLV currently has an ETF Daily News SMART Grade of A (Strong Buy), and is ranked #3 of 34 ETFs in the Precious Metals ETFs category.
About the Author: Taylor Dart
 Taylor has over a decade of investing experience, with a special focus on the precious metals sector. In addition to working with ETFDailyNews, he is a prominent writer on Seeking Alpha. Learn more about Taylor’s background, along with links to his most recent articles. More…