
It’s been a tough week and a half for precious metals investors as the yellow metal (GLD) has been beaten to a pulp after a couple of days spent residing above the $2,000/oz level.
This violent pullback of more than 10% has some second-guessing whether the metal has topped out, but history would suggest that this isn’t likely the case.
While bullish sentiment remains in nosebleed territory which points to further consolidation as highly likely, there are no warning signs present to suggest this bull market has run its course at this time.
The current picture looks very similar to the 2005-2006 period based on one indicator, and gold saw a tremendous run, nearly doubling in the following three years. Let’s take a closer look at the weight of evidence below:
(Source: TC2000.com)
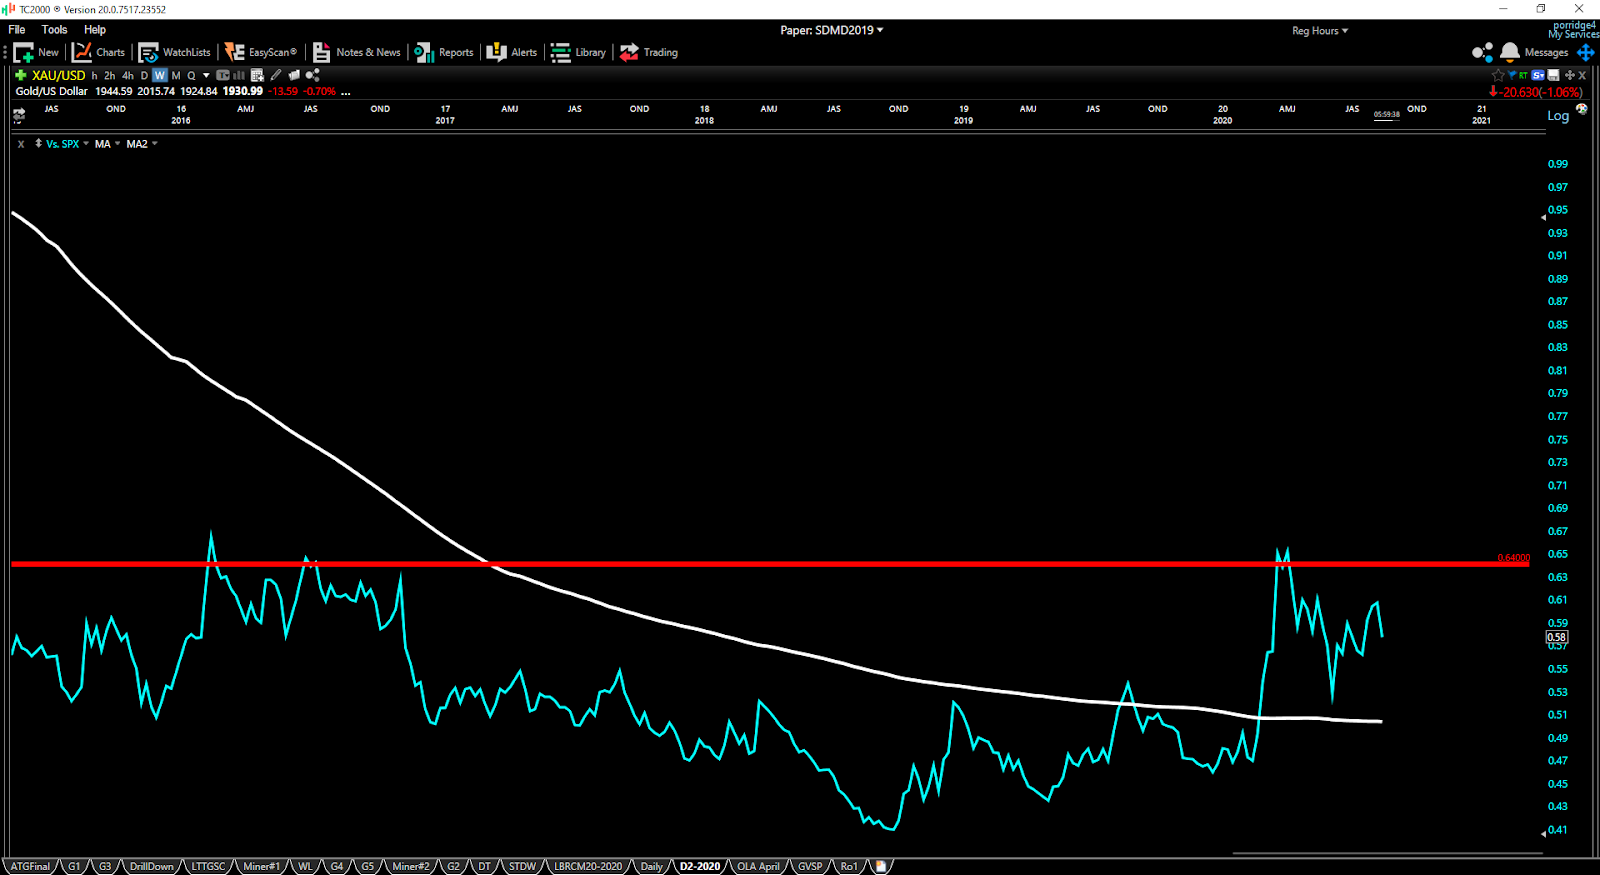
Beginning with a chart of the Gold to S&P-500 ratio (SPY), we can see that gold finally broke above its long-term moving average in February and has remained above this key moving average since.
This is a bullish development as it shows that the metal is outperforming the general markets, and we often see much higher investment in mining stocks when this signal is on a bullish ratio.
While the recent pullback has been quite significant for gold and has this ratio trending lower, I would consider any corrections to be noise.
This is because as long as gold remains above this moving average (white line), the bullish signal on the ratio will remain intact.

(Source: TC2000.com)
If we take a look at the 2004-2008 period, we saw something very similar to the Gold vs. SPX ratio as the ratio consolidated for over a year after an extended downtrend and then finally broke above the moving average in 2005.
Following this breakout, we saw a 15% rally and then a pullback of 12%, which is quite similar to the 20% rally we’ve seen since February and pullback of roughly 10% from early August.
However, the main takeaway from this chart is that the first break and hold above this long-term moving average is a very bullish development long-term.
As we can see, this was just the beginning of the bull market, as the Gold vs. S&P-500 would trend higher with corrections along the way for another six years.
Therefore, given that we just saw the Gold vs. S&P-500 ratio break out in February, I would argue we’re likely in the first few innings of this gold bull market, and nowhere near a long-term top.
This does not mean that gold can’t endure 12-17% pullbacks as bull markets can see nasty shake-outs, but it does suggest that 13% plus corrections are likely to be long-term buying opportunities.
(Source: TC2000.com)
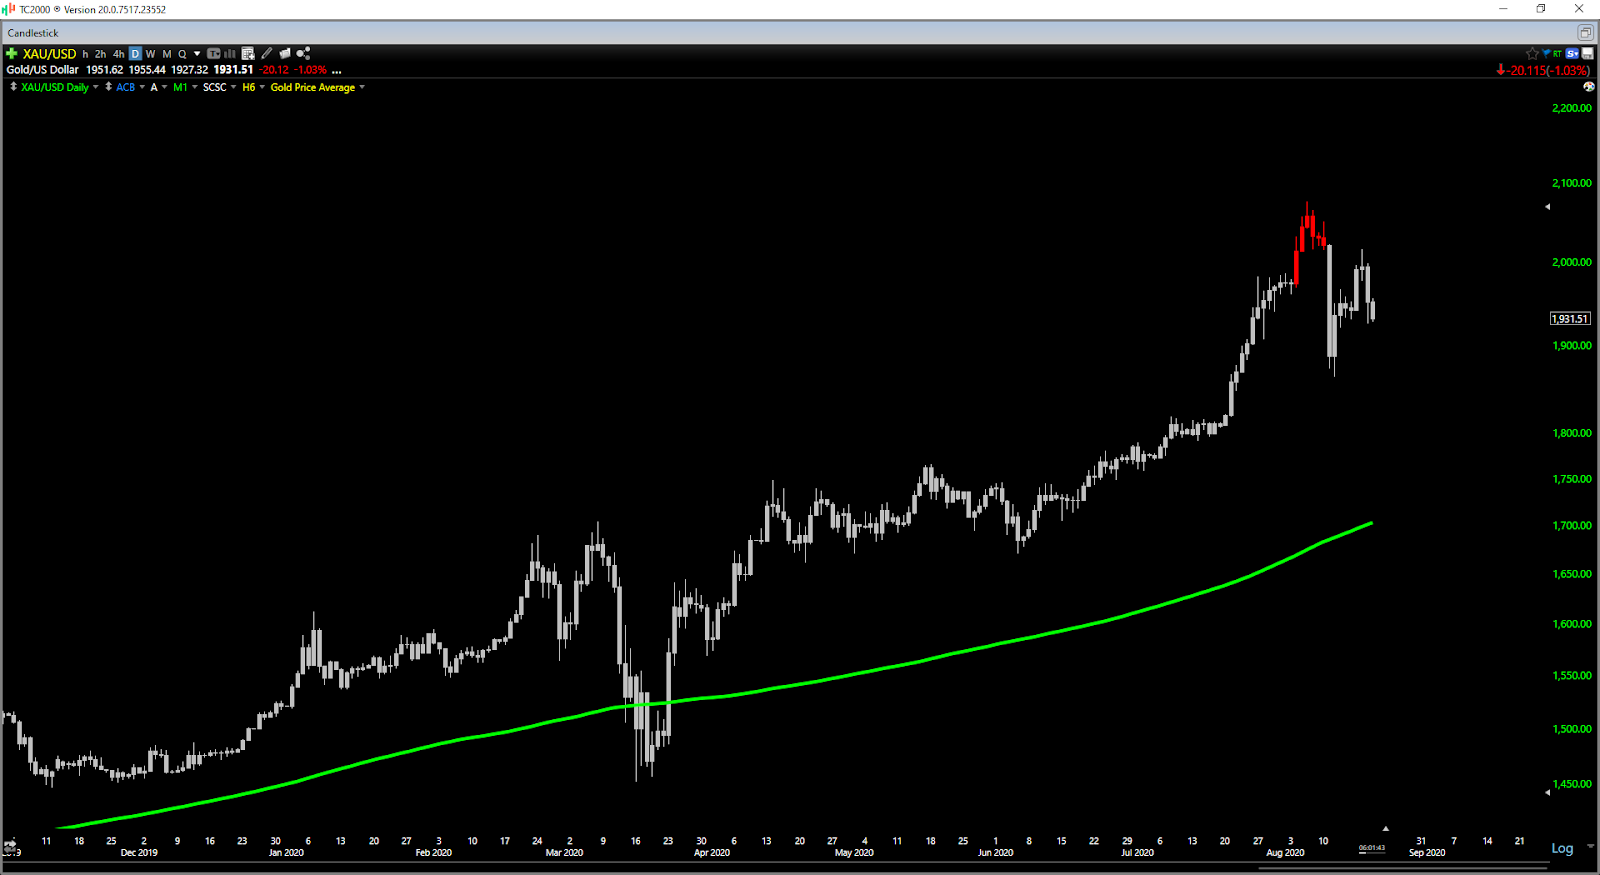
If we take a look at the above daily chart for gold, we’ve fortunately worn off the sentiment sell signal we ran into during early August, where I warned that it not a good time to be adding exposure.
However, while we’re no longer on a sentiment sell signal, we’re still in nosebleed territory here.
This means that while bounces are possible, I believe it’s very unlikely we’ll see new highs in gold before October.
If we were to see $2,100/oz before October, this would be a bearish development, as it would push sentiment from a short-term sell signal to a long-term sell signal.
Instead, what investors want to see is gold consolidate between $1,775/oz to $2,075/oz over the next two months, as this would allow the impatient traders to leave the trade and allow sentiment to reset.
There’s no guarantee that the market will take the ideal path, but this may be the healthiest thing for the gold market currently.
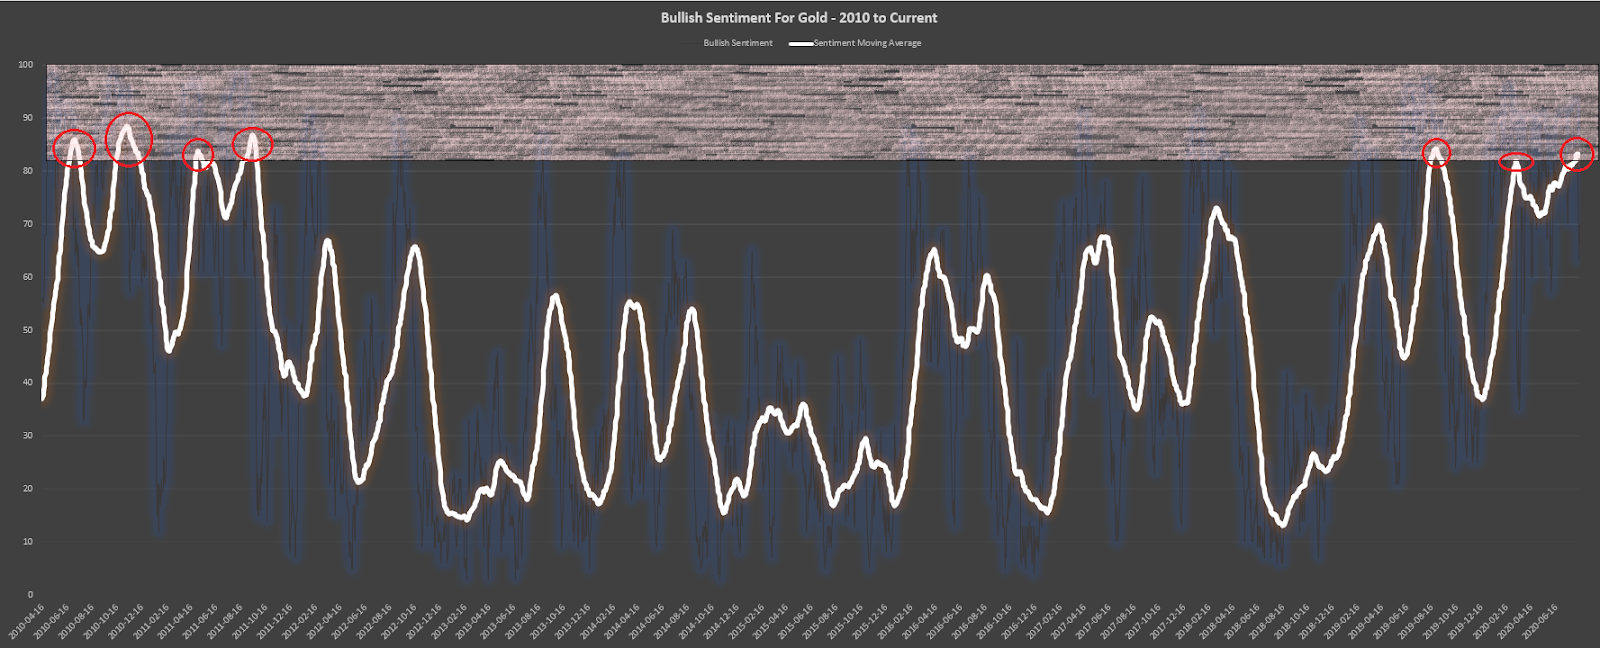
(Source: Daily Sentiment Index, Author’s Chart)
So, what’s the best course of action here?
Given that we have bullish sentiment for gold in nosebleed territory but just outside last week’s sentiment sell signal, I see no reason to rush into the metal.
While bounces are possible as gold can be quite volatile, I see a 50% chance of gold re-testing its lows at $1,860/oz before this correction has run its course, and I would be very surprised if gold made new highs before October. Based on this, I see no reason to be aggressive here.
Having said that, if the metal were to pullback towards $1,805/oz and sentiment begins to reset, this would set up a low-risk buying opportunity heading into what I believe will be a strong Q4 for the metal.
In summary, while this correction has been nasty, it’s unlikely to have long-term consequences as the Gold vs. S&P-500 ratio remains bullish.
However, aggressively buying gold here with sentiment still in nosebleed territory is likely not the best move, so while I am holding several miners and gold, I am not adding to my positions just yet.
Disclosure: I am long GLD, KL, AU
Disclaimer: Taylor Dart is not a Registered Investment Advisor or Financial Planner. This writing is for informational purposes only. It does not constitute an offer to sell, a solicitation to buy, or a recommendation regarding any securities transaction. The information contained in this writing should not be construed as financial or investment advice on any subject matter. Taylor Dart expressly disclaims all liability in respect to actions taken based on any or all of the information on this writing.
Want More Great Investing Ideas?
2 Step Process to Sell @ Market Top in September
9 “BUY THE DIP” Growth Stocks for 2020
The SPDR Gold Shares (GLD) was trading at $181.22 per share on Thursday morning, down $1.02 (-0.56%). Year-to-date, GLD has gained 26.82%, versus a 5.66% rise in the benchmark S&P 500 index during the same period.
GLD currently has an ETF Daily News SMART Grade of A (Strong Buy), and is ranked #1 of 34 ETFs in the Precious Metals ETFs category.