
It’s been an incredible start to Q3 for silver (SLV) as the metal is up over 30% in barely 20 trading days, and this significant move in the metal has brought with it the most optimism we’ve seen in years.
While it was hard to find a $20.00/oz price target for silver during the metal’s doldrums in March, we’ve now got $30/oz and $40/oz silver targets being slapped on the metal, with many analysts looking for these price objectives to be achieved by year-end. This should be worrisome to the bulls, as the metal rarely fares well when everyone is suddenly bullish.
Unfortunately for the bulls, this extreme optimism is coupled with the most overbought reading we’ve seen in nearly a decade, with silver moving up in a parabolic fashion, with the 6-month rate of change now over 30%. Based on the complacency we’re seeing which is evidenced by panic buying, as well as an extreme overbought condition, investors would be wise to be cautious here.
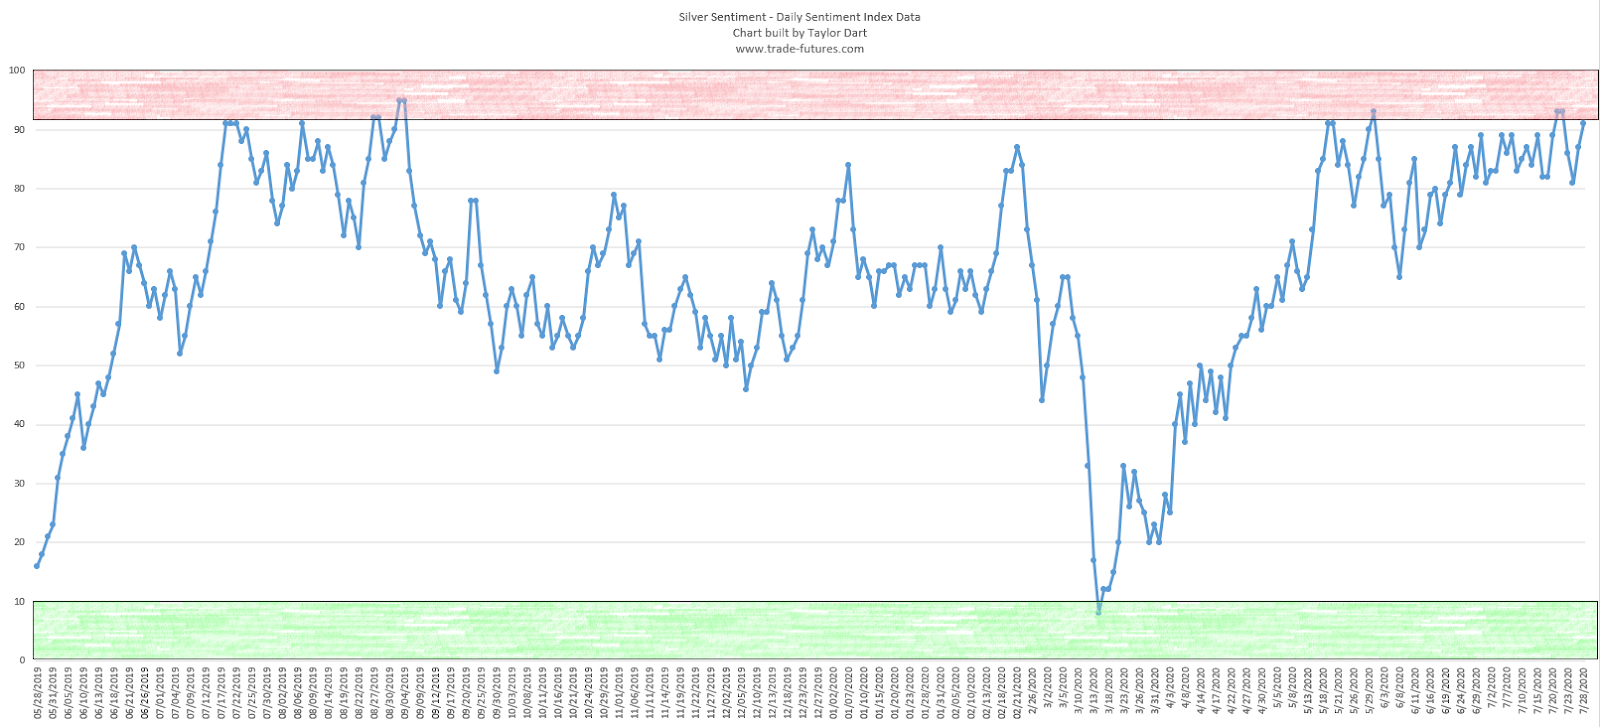
(Source: Daily Sentiment Index Data, Author’s Chart)
As we can see in the chart above of sentiment for silver, we’ve been on a reading of 85% to 94% bulls for nearly two weeks now, which suggests that there is a minimum of 9 bulls for every one bear in the market currently.
This has typically been a warning sign as the red shaded area shows and this is because when everyone is bullish, there’s not many left to buy to support the rally.
The last time this occurred was August of 2019 and the metal-topped shortly thereafter before falling nearly 20% in less than three months. While we don’t need to see a repeat of August 2019, we are certainly in nosebleed territory here which has typically been a good place to book at least some profits.
The one silver lining is that positioning among small speculators has not caught up to prior peaks before, and this is despite a much higher silver price ($24.00/oz vs. $19.00/oz).
While this remains a positive divergence, we are now outside of the moderate pessimism zone below 30,000 contracts. Also, this is typically a lagging indicator as it’s only reported once a week, and therefore, it’s not reflecting today’s prices, but instead last Thursday’s prices.
Therefore, while this divergence suggests we likely haven’t put in a long-term top, there’s no way to rule out a short-term top based on this indicator’s reading.

(Source: CFTC Data, Author’s Chart)
Finally, if we take a look at the technicals below, they are corroborating the complacency we’re seeing in sentiment, as we now have one of the most overbought readings in silver we’ve seen in years.
This current overbought reading has now exceeded the overbought readings of July 2016 and August of 2019, and both of these marked major peaks. The difference this time around is that we have a multi-year breakout as a tailwind, and this is one reason why this won’t likely be a long-term top.
However, multi-year breakout or not, nothing goes up in a straight line. Therefore, some volatility here would not be surprising, nor would a sharp correction to shake out some weak hands and relieve overbought conditions.
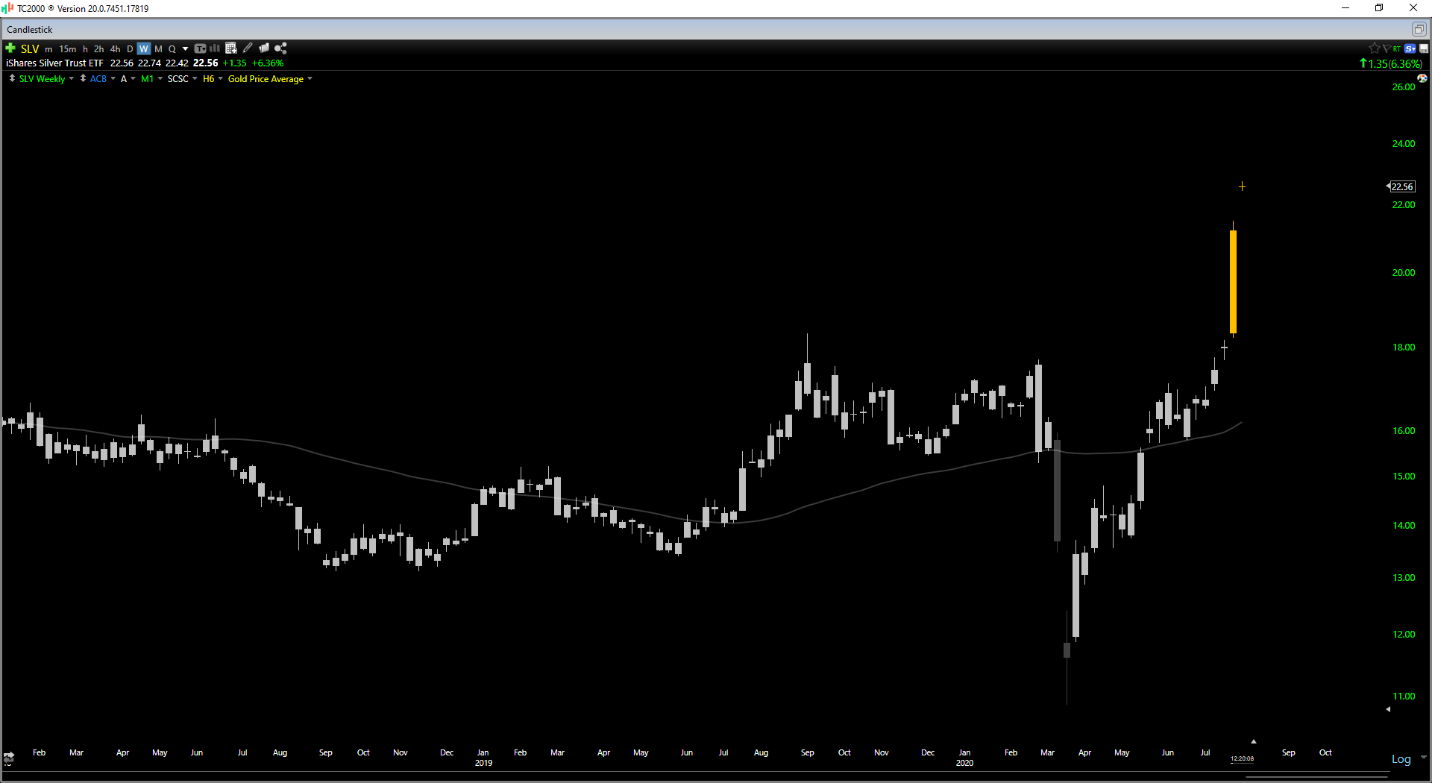
(Source: TC2000.com)
So, what’s the best course of action?
While I generally don’t like to fade breakouts, I have significantly reduced my holdings in a few silver miners yesterday as both the Silver Miners Index (SIL) and silver are hitting very extreme readings, and the odds have increased that we can see a 10-15% correction in silver from $24.50/oz. While this might not be a big deal to stomach for most investors in the metal, it could translate to a 20% drop in many silver miners that have also become very extended recently.
For this reason, I believe investors would be wise to take some profits if they are significantly overweight and look to redeploy that money once sentiment cools off a little.
Of course, there is no guarantee that correction occurs, but I would rather trade in probabilities than worry about rare anomalies. Generally, the time to buy is when no one is interested in the miners and silver, and the time to sell is when everyone is fighting to get in and bidding up the most speculative names. We’ve finally reached that juncture here, and this is why I’ve rung the register on some of my holdings.
Disclosure: I am long GLD
Disclaimer: Taylor Dart is not a Registered Investment Advisor or Financial Planner. This writing is for informational purposes only. It does not constitute an offer to sell, a solicitation to buy, or a recommendation regarding any securities transaction. The information contained in this writing should not be construed as financial or investment advice on any subject matter. Taylor Dart expressly disclaims all liability in respect to actions taken based on any or all of the information on this writing.
Want More Great Investing Ideas?
9 “BUY THE DIP” Growth Stocks for 2020
Newly REVISED 2020 Stock Market Outlook
7 “Safe-Haven” Dividend Stocks for Turbulent Times
The iShares Silver Trust (SLV) was trading at $22.20 per share on Tuesday morning, down $0.63 (-2.76%). Year-to-date, SLV has gained 33.09%, versus a 1.31% rise in the benchmark S&P 500 index during the same period.
SLV currently has an ETF Daily News SMART Grade of A (Strong Buy), and is ranked #4 of 34 ETFs in the Precious Metals ETFs category.
About the Author: Taylor Dart
 Taylor has over a decade of investing experience, with a special focus on the precious metals sector. In addition to working with ETFDailyNews, he is a prominent writer on Seeking Alpha. Learn more about Taylor’s background, along with links to his most recent articles. More…