
It’s been a much better start to the week for investors in the gold (GLD) space, as the metal seems to have finally woken up from a 2-month long slumber, up nearly 3% in the past three trading days.
This push above $1,760/oz has finally allowed gold to regain some relative strength against the S&P-500 (SPY), which has remained on a tear the past several weeks. It’s also helped to quiet the small camp of gold bears, with several convinced that the metal was overdue for a sharp correction after the weak inflation numbers we saw.
While fundamentals can be useful at times and are always worth monitoring, the technical picture always takes precedence, and there is absolutely nothing bearish about a 2-month pause following a multi-year breakout. And while the bears might have a point that inflation numbers were weak, this weakness didn’t dislodge one of the most important fundamental indicators for gold, which remains on a bullish reading.
Let’s take a closer look below:

(Source: Author’s Chart)
As we can see from the chart above, we’ve got the spread between the 3-month treasury bill rate minus the US core inflation rate shown in green. At current levels of 0.10% and 0.10%, respectively, this ratio remains marginally right at the zero line for the time being, despite a massive shift from inflation to near deflation over the past three months. Any readings that are negative are bullish for the gold price, and this is because having negative real rates encourages owning gold, given that there’s no opportunity cost.
Meanwhile, when real rates are rising, there is an opportunity cost to owning gold as an investor is now forgoing interest. While a negative 2.25% reading is obviously much more bullish for gold, as the more negative this reading, the more demand for gold, this current reading remains at parity despite a near unprecedented shift in the inflation rate, from 2.30% just three months ago to 0.10% currently.
It’s also worth noting that if gold truly was weak, this massive recovery in the spread would have dislodged gold and sent it tumbling below its key monthly moving averages, but instead the metal has barely flinched. Sometimes, it’s not the news or the indicator that matters, but it’s the reaction to the news or a change in an indicator. In gold’s case; the metal shrugged off this recovery like it didn’t even happen.
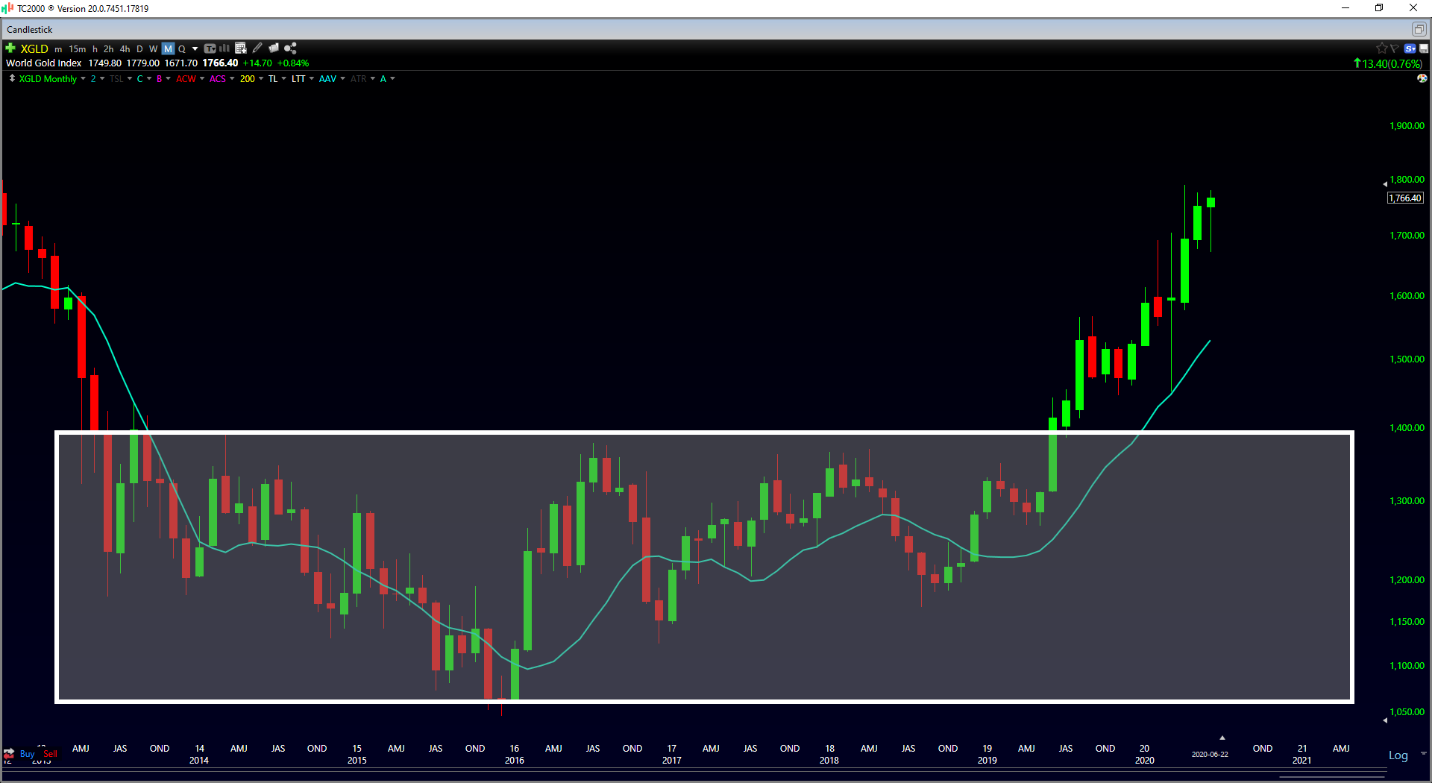
(Source: TC2000.com)
If we take a look at the technical picture above, we can see that gold briefly tested its key monthly moving average (teal line) during the March correction, but has not come near approaching it since. Instead, the metal is sitting just shy of resistance at $1,790/oz and is consolidating at this level. The difference between now and the initial test of this resistance, however, is that the recent pause has allowed the stronger hands to accumulate the metal from those that have tired of the gold trade. This is why we can see that while gold closed in the lower half of its range in April when it first tested this level, it closed in the upper 20% of its range in May, and looks like it will close once again in the upper portion of its monthly range for June. This suggests accumulation as there’s clear demand for any selling pressure, which points to the next significant move in gold being higher.
As always, there’s no guarantee that we have to break out to new all-time highs this year, but it would not surprise me to see gold above $1,920/oz before year-end. While everyone seems focused on the S&P-500, gold is just one year into a multi-year breakout, mirroring the setup we had on the S&P-500 in early 2014.
However, even if gold doesn’t manage to break out above $1,790/oz resistance, the metal will remain bullish with the bulls in control of all time-frames as long as it remains above $1,590/oz. This is currently where the monthly moving average sits, and this area is typically a floor for the metal on any pullbacks. Therefore, for investors looking to add to their positions in gold, the best time to do so would be on any sharp pullbacks towards the $1,600/oz level. For now, I continue to see gold as a Hold, and I remain long from $1,440/oz.
Given that gold has not pulled back like I would have preferred, I continue to accumulate the best miners like Kirkland Lake Gold (KL) below $38.00, as it’s offering a relatively cheap way to buy gold exposure, at a 40% discount to the earnings multiple of its peers with industry-leading costs.
If gold could break out through $1,790/oz on a weekly close, we should see new highs before year-end, and I would not be surprised to see Kirkland Lake Gold back above $46.00.
(Disclosure: I am long GLD, KL)
Disclaimer: Taylor Dart is not a Registered Investment Advisor or Financial Planner. This writing is for informational purposes only. It does not constitute an offer to sell, a solicitation to buy, or a recommendation regarding any securities transaction. The information contained in this writing should not be construed as financial or investment advice on any subject matter. Taylor Dart expressly disclaims all liability in respect to actions taken based on any or all of the information on this writing.
Want More Great Investing Ideas?
9 “BUY THE DIP” Growth Stocks for 2020
Top 3 Investing Strategies for the Year Ahead
7 “Safe-Haven” Dividend Stocks for Turbulent Times
The SPDR Gold Shares (GLD) was trading at $166.05 per share on Tuesday afternoon, up $0.96 (+0.58%). Year-to-date, GLD has gained 16.20%, versus a -2.01% rise in the benchmark S&P 500 index during the same period.
GLD currently has an ETF Daily News SMART Grade of A (Strong Buy), and is ranked #1 of 34 ETFs in the Precious Metals ETFs category.
About the Author: Taylor Dart
 Taylor has over a decade of investing experience, with a special focus on the precious metals sector. In addition to working with ETFDailyNews, he is a prominent writer on Seeking Alpha. Learn more about Taylor’s background, along with links to his most recent articles. More…