
We’ve seen a strong recovery for the Gold Miners Index (GDX) over the past few days, and several of the leading names continue to firm up on their weekly charts, building large bases following their multi-year breakouts. However, the recent pullback in the mining stocks has made quite a few investors skittish, after leading names like Barrick Gold (GOLD) and Newmont Corporation (NEM) fell over 20% from their April highs.
While this is quite a significant correction for stocks that are supposedly in a bull market, it’s important to put this move in context, and this is why long-term charts are so helpful. It’s also worth noting that gold has not looked this good on a relative basis vs. the S&P-500 (SPY) in years, which emboldens the view that this breakout in miners is for real.
Let’s take a closer look below:
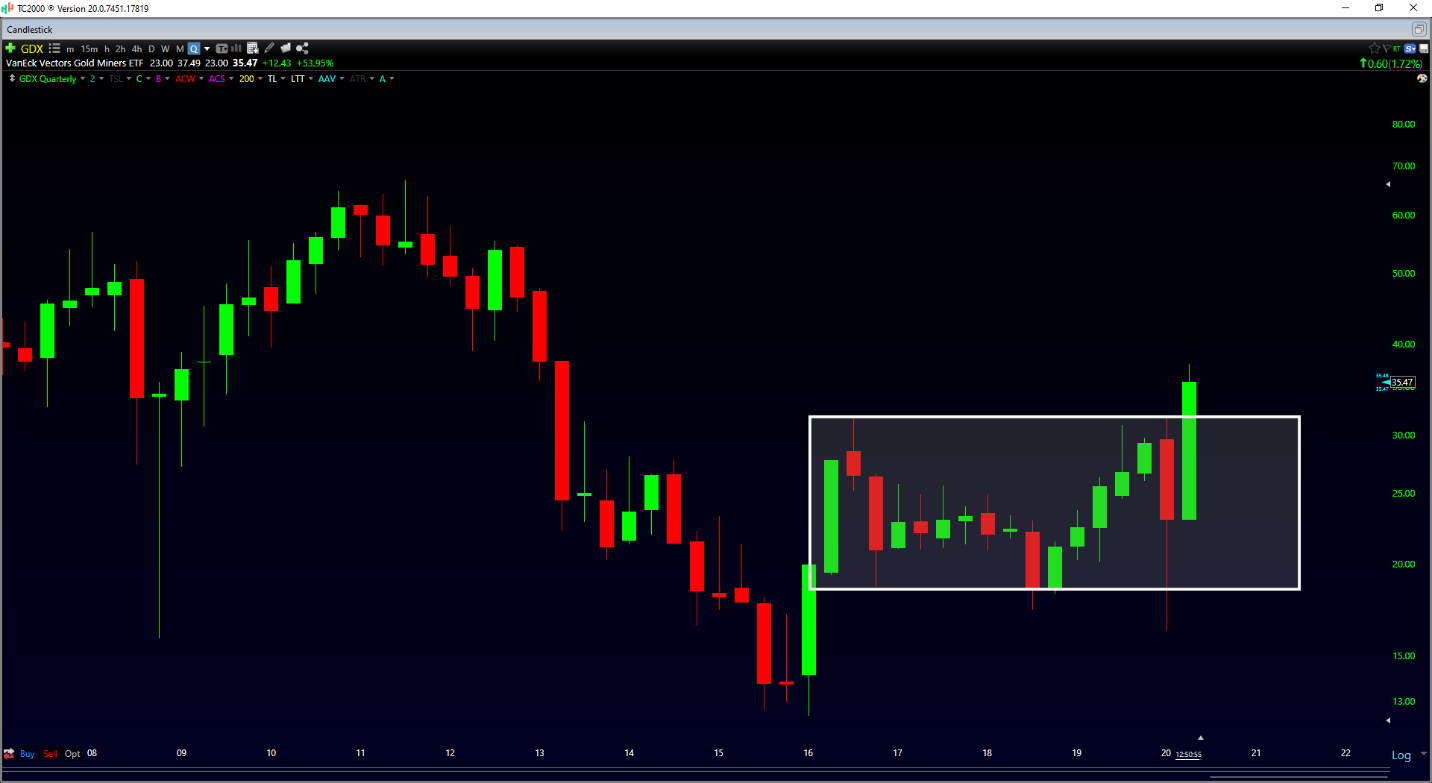
(Source: TC2000.com)
If we look at the above chart of the Gold Miners Index, we can see that the GDX has pushed to new multi-year highs in Q2 of this year, after briefly trading down to multi-year lows during the mid-March turbulence. While the recent 20% correction might have been a little unnerving to those that chased the GDX in May, it did not even register as a blip on this quarterly chart. This is because we didn’t reverse below the breakout near the $31.00 level on the correction. The fact that the GDX rallied by over 100% off of its March lows and institutions stepped up to add to their positions immediately at just a 20% pullback suggests that there is some real power behind this move, as we saw the exact opposite in 2016.
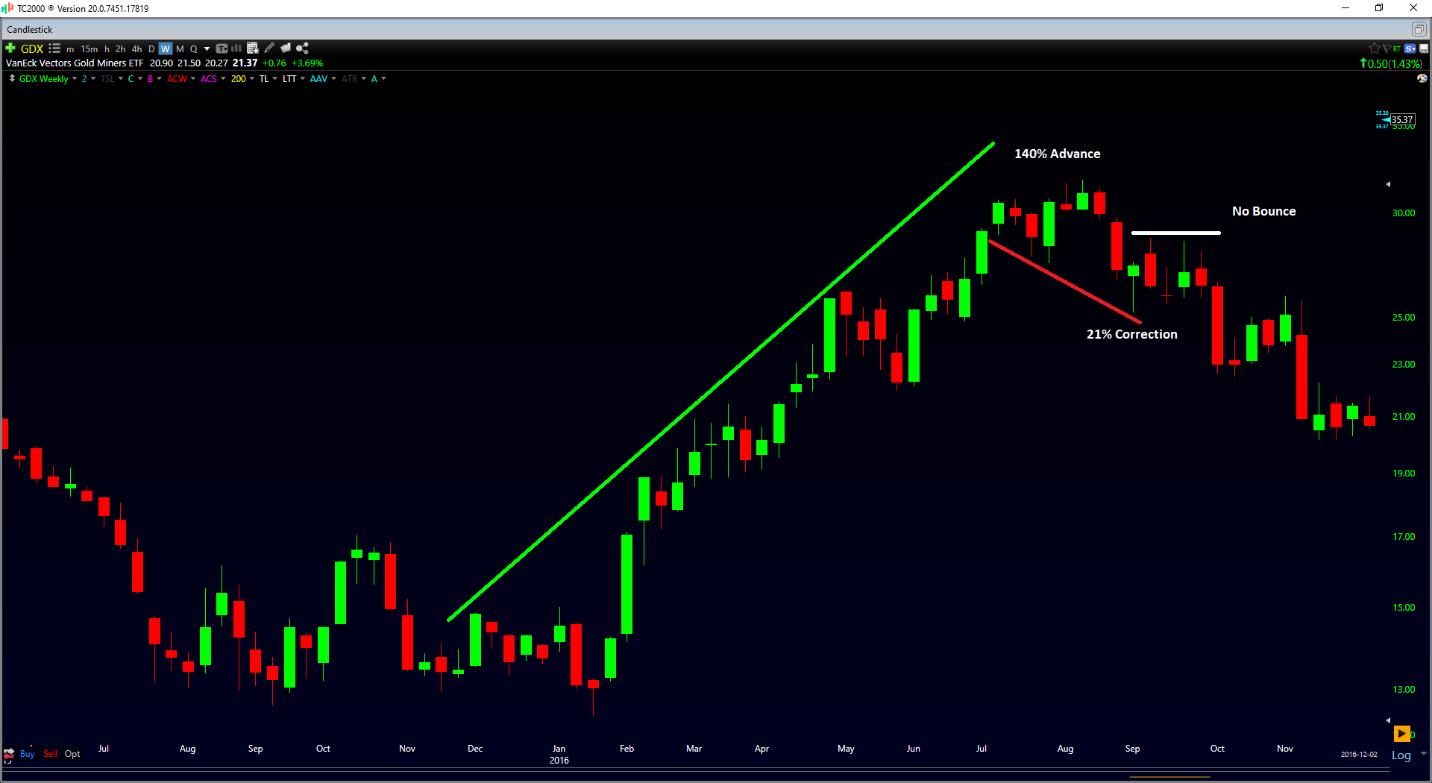
(Source: TC2000.com)
During 2016, we also saw a triple-digit rally, with a 20% correction that followed, but the difference is that there was no bounce following this correction. Instead, the index merely meandered sideways for a couple of weeks and then plunged to new lows shortly after that.
This time around, we’ve defended a critical level, and we’ve seen strong buying pressure exactly where we need to, and this points to this being a shake-out vs. the first down leg in a massive correction like 2016 was. However, for those watching the hourly and daily charts, it’s easy to get caught up in the noise and believe that this is something more. While there’s nothing wrong with watching these short-term charts, it’s worth it to get perspective and size up the move from a bigger picture standpoint at the same time.

(Source: StockCharts.com)
The other reason that I believe that we are not seeing a repeat of 2016 is due to the entirely different look of gold (GLD) vs. the S&P-500 (SPY) currently. As we can see on the left side of the chart, gold saw a significant rally in 2016, but this advance did nothing to improve the Gold vs. S&P-500 ratio, as the indicator ran up and failed near its weekly moving average.
This time around, however, we’ve seen gold break out above its key weekly moving average, and this is the first time since 2011 that gold has led the S&P-500. Given that gold is leading the S&P-500, this increases the probability that gold’s breakout at $1,400/oz was a real one. In turn, this suggests that the GDX’s breakout this time around is also likely going to be successful. Therefore, for investors looking to monitor for signs that this is a bull trap in the GDX, this indicator will be critical. As long as the Gold/S&P-500 ratio holds above 0.50, I see no reason to panic.
So, what’s the best course of action here?
For those investing in miners, I believe the best move here is to hold here. As noted last week, there was an opportunity to begin doing some buying while GDX was below $32.50, and I continue to believe that pullbacks will present buying opportunities. However, with many miners now up 15% off last week’s levels, only a couple of names are left that are relatively attractive from a valuation standpoint, with the stand-out being Kirkland Lake Gold (KL).
Based on this, I see the best move here as holding the GDX and other miners and adding to Kirkland Lake Gold below $38.50. Further weakness in the GDX is entirely possible as the earliest innings of a new bull market can be the most choppy, but investors should not lose sight of the big picture. As long as the bulls continue to defend the $31.00 level, sharp corrections are merely noise designed to shake out weak hands before they can profit from the eventual move higher.
(Disclosure: I am long GLD, KL)
Disclaimer: Taylor Dart is not a Registered Investment Advisor or Financial Planner. This writing is for informational purposes only. It does not constitute an offer to sell, a solicitation to buy, or a recommendation regarding any securities transaction. The information contained in this writing should not be construed as financial or investment advice on any subject matter. Taylor Dart expressly disclaims all liability in respect to actions taken based on any or all of the information on this writing.
Want More Great Investing Ideas?
9 “BUY THE DIP” Growth Stocks for 2020
Top 3 Investing Strategies for the Year Ahead
7 “Safe-Haven” Dividend Stocks for Turbulent Times
The VanEck Vectors Gold Miners ETF (GDX) was trading at $35.32 per share on Tuesday afternoon, up $0.45 (+1.29%). Year-to-date, GDX has gained 20.63%, versus a -1.91% rise in the benchmark S&P 500 index during the same period.
GDX currently has an ETF Daily News SMART Grade of B (Buy), and is ranked #19 of 34 ETFs in the Precious Metals ETFs category.
About the Author: Taylor Dart
 Taylor has over a decade of investing experience, with a special focus on the precious metals sector. In addition to working with ETFDailyNews, he is a prominent writer on Seeking Alpha. Learn more about Taylor’s background, along with links to his most recent articles. More…