
Both gold (GLD) and silver (SLV) had exceptional year-end runs, with both metals closing out December with 3% and 4% advances, respectively. The 3-month Treasury Bill Rate (1.55%) continues to trade well below the U.S. annual inflation rate (2.10%) supports a bullish backdrop for the metals on a big picture basis, short-term, silver is sitting just a couple of percent shy of key resistance. Based on this, I believe investors would be wise to be patient when it comes to adding new exposure, as the next strong support level sits more than 10% below, and the metal is beginning to get a little overbought short-term. Therefore, the best course of action is holding, and waiting for weakness to add new exposure to the metals.
One of the best fundamental indicators for gauging the direction of gold prices is measuring the 3-month Treasury Bill Rate, and subtracting the 12-month rate of change for CPI from this reading. When this calculation yields a negative reading as it does currently (1.60% minus 2.10%), this provides a bullish backdrop for gold prices. The reason for this is that the Fed is increasing the money supply at a pace that’s quicker than inflation is consuming that supply. The most dramatic readings we saw for this indicator were in the late 1970’s to early 1980’s, and those that know history are well aware, this led to a massive bull market in gold. So goes gold, generally goes the price of silver, and therefore this fundamental backdrop continues to provide a boon for metals prices as we start the new year.
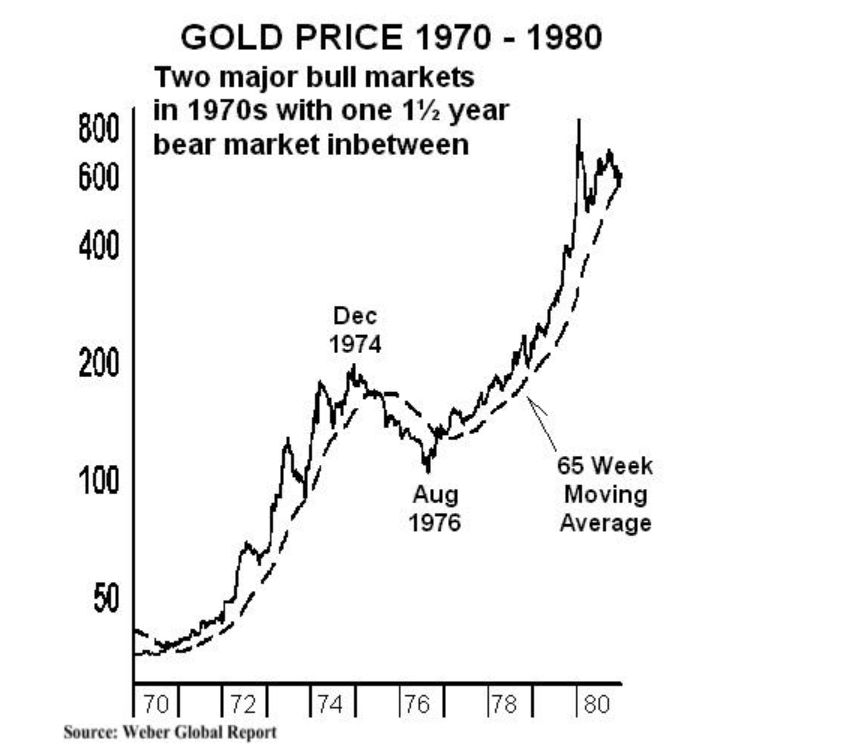
(Source: Weber Global Report, WyattResearch.com)
As we can see in the below chart, this reading ended Q1 at (+) 0.60, but has dramatically dropped since, and has been in negative territory for over three months now. While inflation rates have only increased slightly from 1.80% to 2.10%, the more pronounced change in this indicator has occurred due to the plunge in the 3-month Treasury Bill Rate. The 3-month Treasury Bill Rate has dropped from 2.30% in April to 1.50% currently, and this is what has helped to push this indicator so far into negative territory. As long as inflation remains steady and rates remain low, this will continue to provide a tailwind for gold prices, and silver prices should follow. Given the continued Fed injections with the increased Repo market operations since Q4 began, one would argue that inflation can only go higher from here, and this should keep this indicator in bullish territory for the metals.

(Source: Author’s Chart, YCharts.com)
The good news for silver bulls is that what’s bullish for gold is generally what’s bullish for silver, with silver bull markets generally lagging gold bull markets by a year or two. We saw this lag when gold began its bull market in 2003, but silver didn’t wake up until 2004, and if this pattern plays out similarly, silver should finally wake up in a big way in the back half of 2020, given that the gold bull market breakout occurred in Q2 2019. Therefore, in terms of the bigger picture, investor should be focused on buying the dips.

(Source: TC2000.com)
However, patience in buying dips is essential to reaping the most rewards, and it does not pay to buy a volatile asset near the top of its trading range. Given that silver has been stuck in a range between $16.00/oz and $19.00/oz for the past few months, I do not believe it’s wise to be adding exposure up here above $18.00/oz on silver, and just 2% below resistance at $18.45/oz. Instead, investors would be wise to take advantage of 5-7% pullbacks in silver to add exposure to miners or the metal, as this will generally lead to capital being put to work more effectively.
To summarize, I see no reason to chase silver or silver miners here, but I do believe that any sharp dips below the $17.00/oz will continue to provide buying opportunities. The last ideal add point for silver was near $16.50/oz in Q4, and the key to winning when it comes to volatile assets and buying weakness, not chasing strength and assuming the market is going to explode higher any moment. While the fundamental backdrop remains as bullish as ever for metals, this is not an excuse for chasing rallies, and I am looking at the $17.25/oz level or lower to add exposure to silver or silver miners. If I do not get a pullback to these levels, I will simply stick to my gold position from $1,455/oz, and wait for an opportunity at a later date to add exposure.
The iShares Silver Trust (SLV) was trading at $16.79 per share on Thursday morning, up $0.11 (+0.66%). Year-to-date, SLV has gained 5.00%, versus a 21.41% rise in the benchmark S&P 500 index during the same period.
SLV currently has an ETF Daily News SMART Grade of C (Neutral), and is ranked #9 of 33 ETFs in the Precious Metals ETFs category.
About the Author: Taylor Dart
 Taylor Dart has over 10 years of experience in active & passive investing specializing in mid-cap growth stocks, as well as the precious metals sector. He has been writing on Seeking Alpha for four years, and managing his own portfolios since 2008. His main focus is on growth stocks outperforming the market and their peers. In addition to looking at the fundamentals, he uses different timing models for industry groups, and scans upwards of 2000 stocks daily to identify the best fundamental opportunities with the timeliest technical setups. Taylor is a huge proponent of Trend Following and the “Turtles” who enjoyed compound annual growth rates of over 50 percent per year.