
While the equity market bulls continue to enjoy a rout of new highs, those in the metals complex are likely feeling left out. Gold (GLD) has sunk 7% from its August highs near $1,560/oz, and silver (SLV) has fared much worse, with a 15% drawdown from those highs. This has likely been a grueling experience for those that chased in September, but this pullback has been a necessary reset for bullish sentiment. Unfortunately, many bulls don’t seem to understand that when everyone is upbeat, and we have ten bulls for every one bear, there is no ammunition left to push the market higher. With some of the weak hands now shaken out and bullish sentiment on silver down from 95% to 55%, a good chunk of this reset is now complete. Based on this, I believe silver bulls should be ready to embrace any further weakness into the seasonally weak first half of December. Let’s take a closer look at the charts below:
If we take a look at a monthly chart of silver with short-term stochastics, we can see just how manic the market was getting as we headed into the month of September. This indicator pushed above the 80% level, which often marks a short-term ceiling, and the metal has since reversed sharply from this level. The last time we hit this area was in the fall of 2016, and this set up a more than 20% decline over the next four months. Therefore, one would have had to have been crazy not to be booking profits at the time.

(Source: TC2000.com)
The good news is that after three months of corrective action we are now back below the 60% level. While this doesn’t mean we have bottomed out here as the 2016 correction got much worse before we saw any reprieve from the selling pressure; it is a step in the right direction.

(Source: TC2000.com)
If we look at the monthly chart with the 10-month and 20-month moving averages, we can see that our bullish cross is still intact for the time being. Generally, 10-month crossovers at the 20-month moving average are a sign of medium-term momentum (6-12 months), and the last reading was a bearish one in the fall of 2017. This overbought reading led to a 20% decline over the next 12 months, and this suggested that one would be wise to sell into rallies as monthly momentum was working against them. In September, however, we got a bullish cross on this indicator, which increases the odds of dips being bought. For the time being, this indicator remains on a buy signal, and the 20-month moving average is beginning to assume a positive slope, which is also a positive development. As long as the bulls defend this area of support between $15.70 – $16.25, they have the benefit of the doubt here.
(Source: TC2000.com)
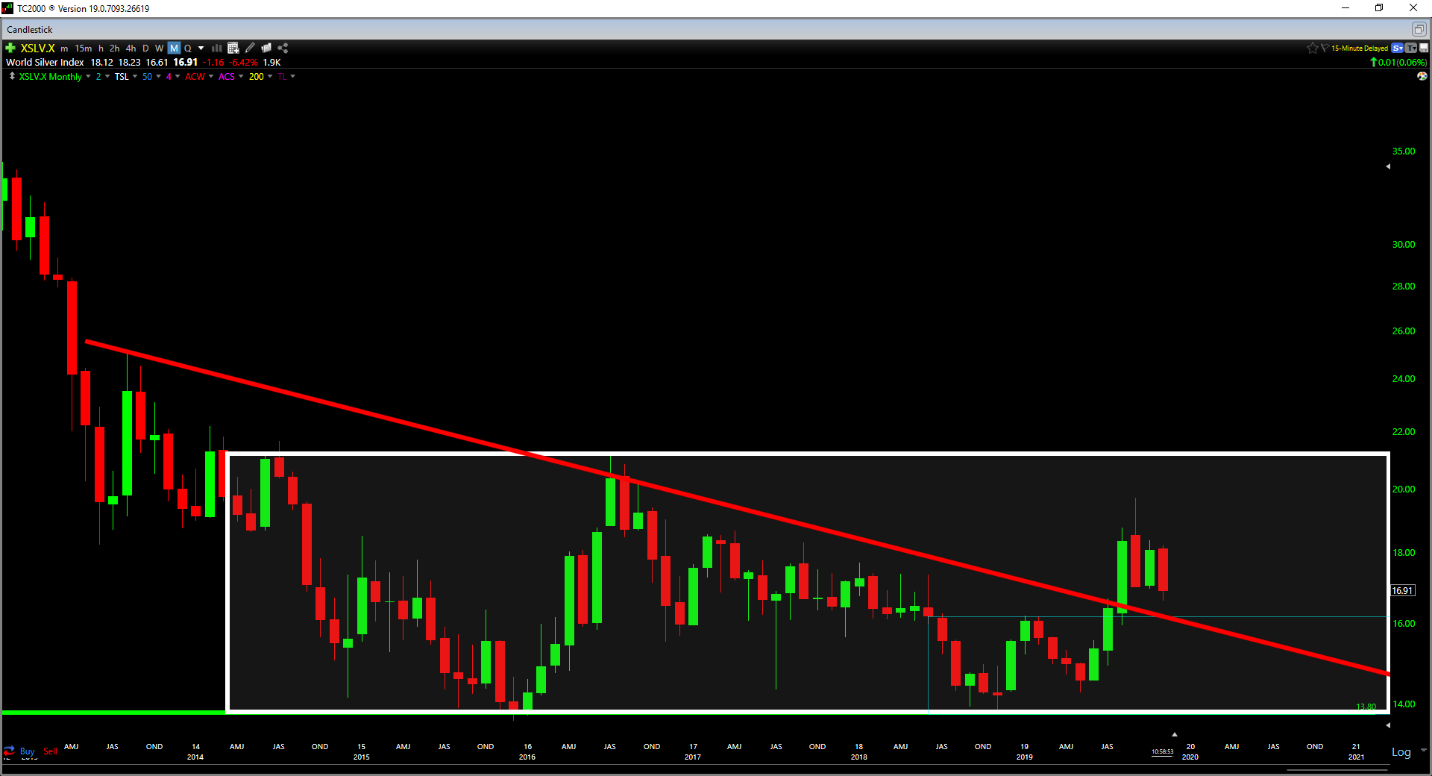
Finally, taking a look at the downtrend line the metal broke earlier this year, we still are showing commitment, albeit barely, to this breakout. As we can see in the above chart, the red downtrend line was broken in August, and the metal is now coming back down to retest this level. Therefore, thus far, this is just a correction that is re-testing a crucial prior resistance level. As long as the bulls can play defense here, I don’t see any reason for panicking during this correction.
To summarize, the bulls have a substantial area of support between $15.60/oz and $16.25/oz, and this is a must defend level. If the bulls can successfully defend this zone, this is a low-risk area to build positions in the metal and silver miners. However, a failure to hold onto the $15.60/oz level would suggest that this move was potentially a cyclical bounce within the current secular bear market and that it’s time to take off any aggressive positions. Given that sentiment has not yet capitulated, I see no reason to be a buyer at current levels. However, the next pullback may finally provide that opportunity, and investors should be watching for a pullback to 40% bulls or lower in silver to suggest the worst is over.
(Disclosure: I am long gold from $1,455/oz, and $136.80 on GLD)
The iShares Silver Trust (SLV) was trading at $15.92 per share on Friday afternoon, up $0.08 (+0.51%). Year-to-date, SLV has declined -0.44%, versus a 18.25% rise in the benchmark S&P 500 index during the same period.
SLV currently has an ETF Daily News SMART Grade of C (Neutral), and is ranked #9 of 33 ETFs in the Precious Metals ETFs category.
About the Author: Taylor Dart
 Taylor Dart has over 10 years of experience in active & passive investing specializing in mid-cap growth stocks, as well as the precious metals sector. He has been writing on Seeking Alpha for four years, and managing his own portfolios since 2008. His main focus is on growth stocks outperforming the market and their peers. In addition to looking at the fundamentals, he uses different timing models for industry groups, and scans upwards of 2000 stocks daily to identify the best fundamental opportunities with the timeliest technical setups. Taylor is a huge proponent of Trend Following and the “Turtles” who enjoyed compound annual growth rates of over 50 percent per year.