
Investors were willing to buy in for a second day in a row, encouraged the economy may get some help after all. Though it peeled back from its intraday high and volume was soft, the S&P 500 still ended Thursday’s action up 0.64%.
Netflix (NASDAQ:NFLX) led the charge, gaining nearly 5% after Goldman Sachs dished out some kind words about the company. Despite its price-target cut, the investment bank still likes the stock, suggesting it only posed a “modest risk” relative to expectations. Freeport-McMoRan (NYSE:FCX) rallied roughly as much in response to an upgrade from UBS. The bank is a fan of the fact that the mining outfit is selling off some of its weaker assets, and further predicts copper prices will rise from here.
Holding the market back was PG&E (NYSE:PCG). The beleaguered utility name, driven to bankruptcy due to its role in California’s devastating wildfires, plunged 29% when a judge ruled that key owners of the company’s bonds would be allowed to submit a bankruptcy proposal of their own that could work against equity owners.
None of those names are as compelling as stock charts of AbbVie (NYSE:ABBV), Applied Materials (NASDAQ:AMAT) and Chubb (NYSE:CB) are today. Here’s why they earned a spot on watchlists.
Applied Materials (AMAT)
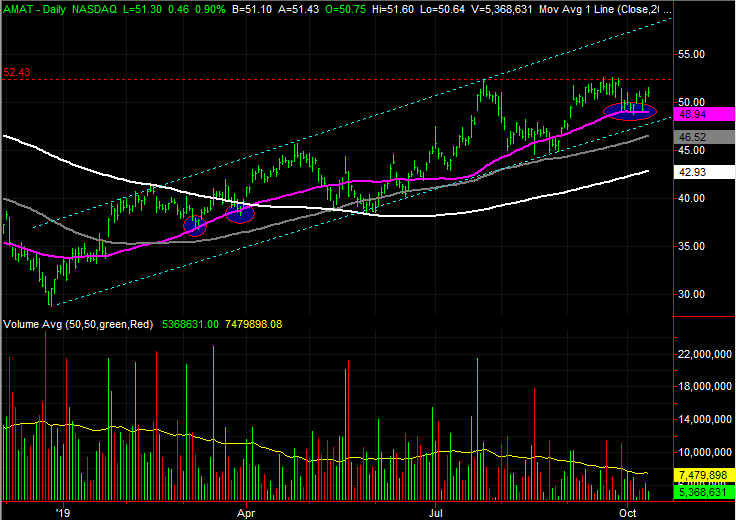
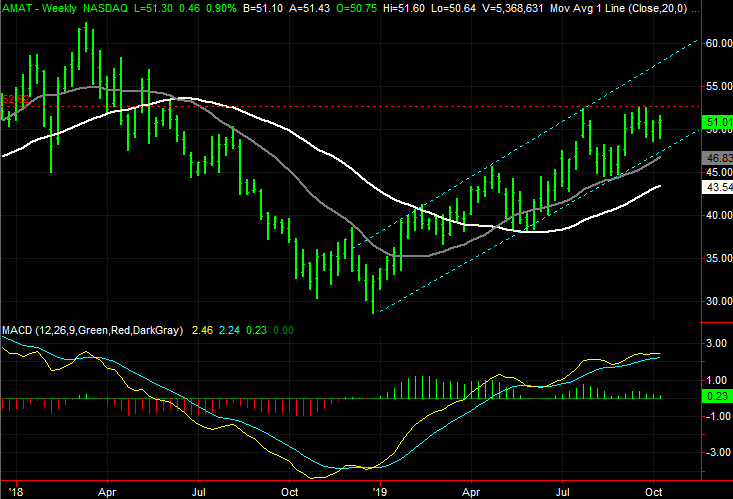
It has been anything but a straight-line move, but Applied Materials shares have made reliable progress since December’s bottom. The ebbs and flows have left behind a well-defined set of rising support and resistance levels, plotted as light blue dashed lines on both stock charts.
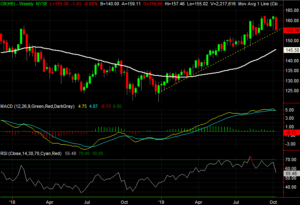
Assuming the pattern is still repeating itself, there’s more upside ahead following August’s rebound. Last week and this week gave us more evidence that AbbVie is en route to the upper boundary of its trading range. On the other hand, a couple of new concerns have taken shape.
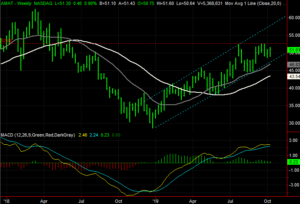
Click to EnlargeChief among the concerns is the possibility that horizontal resistance has taken shape around $52.40, where the stock topped out in July and then again in September.- The other bearish red flag here is the lack of volume behind the current advance, and the fact that the weekly chart’s momentum is waning. That is, the once-rising MACD lines are flattening out.
- The good news is, the purple 50-day moving average line served as technical support last week and this week, upping the odds of a breakout beyond the ceiling at $52.40.
Chubb (CB)
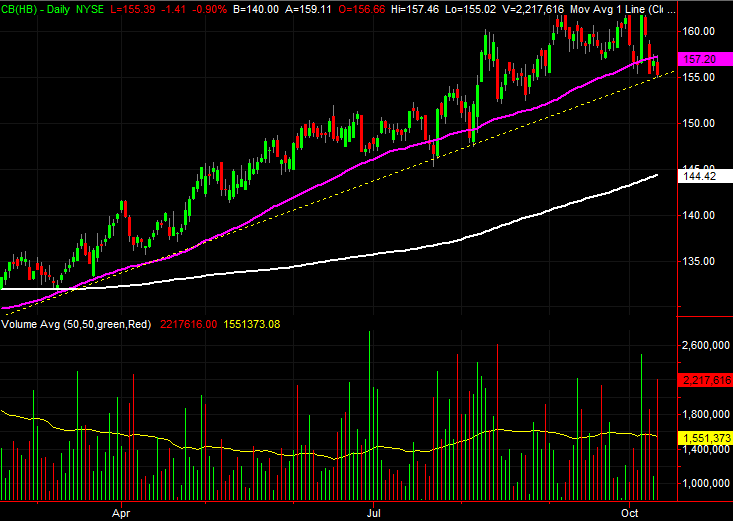
The bears have tried to knock Chubb off of its bullish course several times since December’s low. Each time the bulls stepped up to the plate, rekindling the rally. The end result is the establishment of a rising support line marked in yellow on both stock charts.
That floor is being tested now thanks to this week’s selloff. But, this time is notably different than the prior instances. This time, CB stock is ripe for a lot of profit-taking, and the bulls are on their heels. One more bad day could start a selling avalanche.
Click to EnlargeOn the weekly chart the vulnerability is evident in two ways. One of them is the fact that shares reached a full RSI-overbought condition in August. The other is this week’s MACD crossunder.- Those aren’t the only red flags on the weekly chart. While it took a day-by-day effort to make it happen, the sheer size and scope of the setback this week translates into the biggest weekly selloff since October of last year. That sweeping change of heart (for no discernible reason) is telling in and of itself.
- Underscoring this week’s big losses are a couple of days of high volume selling. The would-be sellers have largely tipped their hand. They’re worried.

AbbVie (ABBV)
After an incredible 2017, AbbVie investors have experienced little more than misery. Shares peaked in early 2018, and the downtrend in the meantime was renewed just around each time it looked like it would finally come to a close.
The rebound effort that’s taken shape since August may end the same way. But, the bottom leading into that rebound was different than any of the previous ones. It may have cut deep enough to act as a capitulation. We need one more good ‘umph’ to know for sure, as that would finally get a pent-up rebound underway.

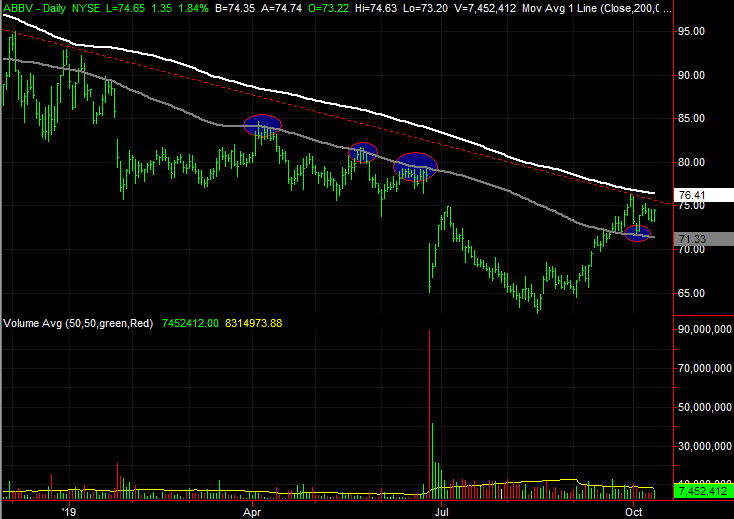
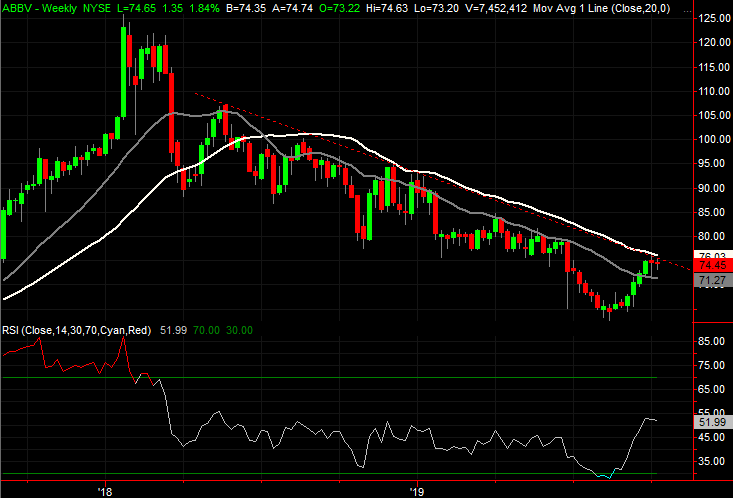
Click to EnlargeThe make-or-break line now is the line that connects all the key peaks since May of last year, plotted as a red dashed line on both stock charts. That resistance is being tested right now.- The selling may have hit a climax and set the stage for a prolonged reversal in August, as the weekly chart finally saw its RSI indicator line finally move to the sub-20, oversold level then.
- Underscoring the bullish case is the recent action at and around the gray 100-day moving average line. ABBV stock failed to hurdle that line on three attempts earlier this year, but found support there at the beginning of this month (highlighted).
As of this writing, James Brumley did not hold a position in any of the aforementioned securities. You can learn more about him at his website jamesbrumley.com, or follow him on Twitter, at @jbrumley.