
Another batch of alarming headlines rattled investors for a second day in a row on Wednesday, sending the S&P 500 to a loss of 1.79%. Not only did the PMI Manufacturing Index roll in below the critical 50 level for September, investors were forced to weigh the meaning behind the lackluster ADP payrolls report for last month.
Ford (NYSE:F) helped set the tone — and the pace — with its near-3% tumble following news that its third-quarter unit sales fell 4.9% on a year-over-year basis. Delta Air Lines (NYSE:DAL) logged an even bigger loss of nearly 5% though, after undercutting an impressive September traffic report with a disappointing third-quarter outlook.
There were a handful of winners, like FireEye (NASDAQ:FEYE). The cybersecurity stock popped more than 4% in response to whispers that the company could be putting itself up for sale. There just weren’t enough names like FEYE to keep the overall market out of the red.
Headed into today’s action, the stock charts of eBay (NASDAQ:EBAY), Lennar (NYSE:LEN) and Coca-Cola (NYSE:KO) have earned a closer look. Here’s why, and what’s apt to take shape next.
Coca-Cola (KO)
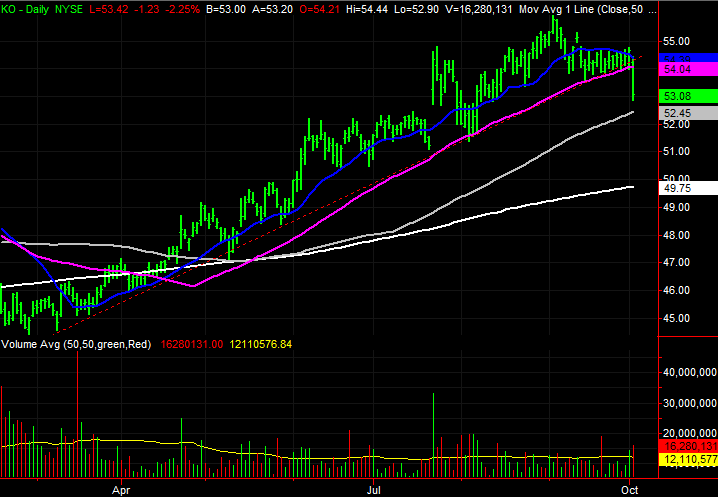
Just a couple of weeks ago, Coca-Cola shares were finding support right where they needed to the most. In fact, two important support levels were in play, both working together to keep an uptrend alive even after the advance started to run out of gas.
The advance snapped in earnest yesterday though. In one fell swoop, KO stock broke under both support levels, setting the stage for lower lows. Yes, the move had more to do with the broad market than Coca-Cola specifically. It just doesn’t matter, as the big rally still leaves KO shares vulnerable to more downside.
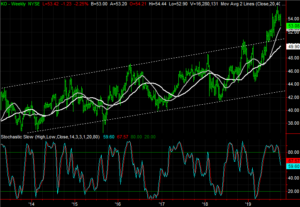
Click to EnlargeThe key technical floor that had been in place was the 50-day moving average line, plotted in purple on the daily chart. Last week’s lows also more or less aligned with the big lows going back to March.- Zooming out to the weekly chart also put things in perspective. This year’s incredible gain is also something of an outlier, in that it catapulted Coca-Cola well out of a well-established trading range marked by white dashed lines on the weekly chart.
- How far any downside action may drag KO stock isn’t clear, but at the very least the gray 100-day moving average and the white 200-day moving average lines make for good checkpoint targets.

eBay (EBAY)
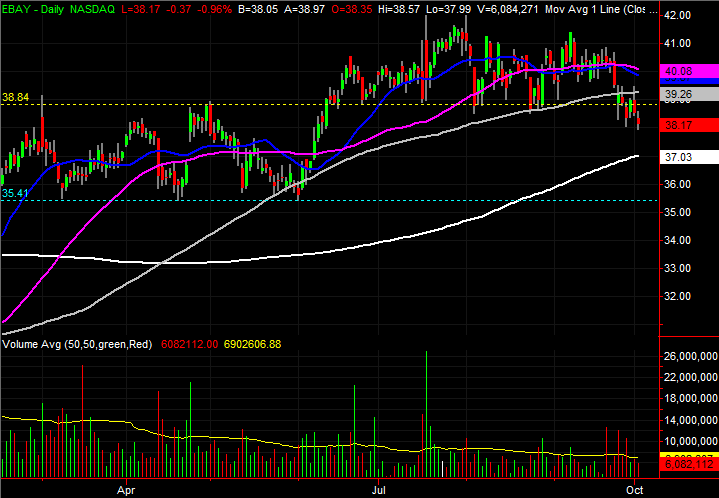
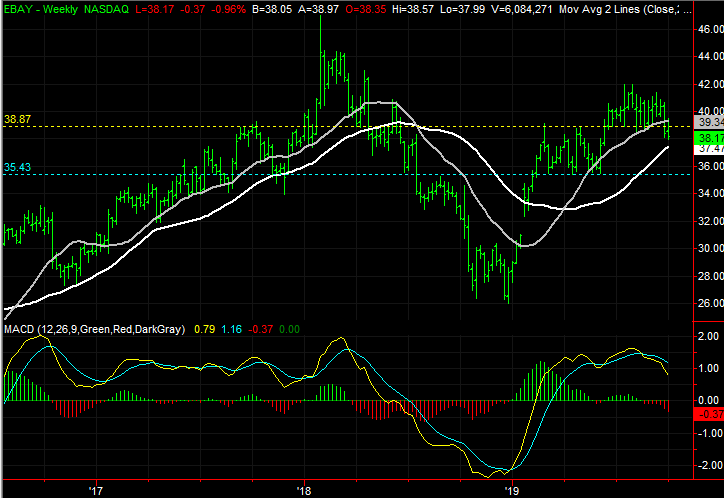
The last time we looked at eBay back on Aug. 28, it was putting pressure on a key technical support line. Namely, it was testing its 100-day moving average line as a floor, and had also started to find technical support at what had previously been a technical ceiling.
Shares of the online-auction outfit backed away from the edge of that cliff in September, but the risk never really went away. Although inspired more by marketwide bearishness than company-specific worries, both of those floors buckled last week. One of them has since been confirmed as a new resistance area.
Click to EnlargeThe make-or-break line in the sand was and still is the 100-day moving average line, plotted in gray on both stock charts. EBAY stock tried to break back above that line on Tuesday, but that effort crumbled.- The horizontal level at $38.84, marked as a yellow dashed line, was a ceiling early in the year that turned into a floor during Q3. It’s no longer a floor, however.
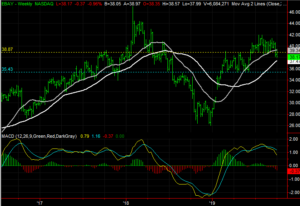
- Assuming this pullback has legs and will get traction, the next most likely landing spot is around $35.40, where eBay found support during the first quarter. That’s marked in blue on the weekly chart.
Lennar (LEN)
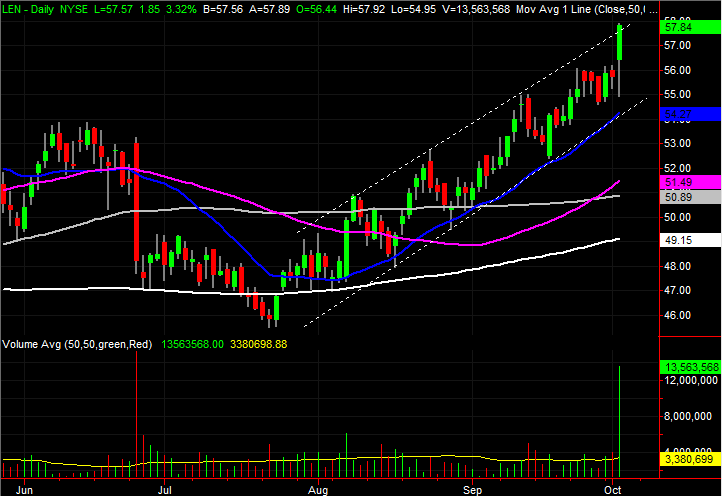
Finally, Lennar was not just one of Wednesday’s rare winners, it was a big one, gaining more than 3% after reporting unexpectedly solid Q3 results. The big move led most other homebuilding stocks higher as well.
The move should be taken with a grain of salt though, and perhaps viewed a little suspiciously. Although the speed and scope (and volume) of the rally is impressive, it also demonstrates some of the key hallmarks of a pretty significant — even if temporary — top.
Click to EnlargeThe volume spike is one red flag. It suggests the last of the would-be buyers finally plowed in on good news. With nobody else left to buy, the smart-money crowd could soon start to take profits.- Underscoring that idea is the 27% advance reaped just since mid-July and the fact that LEN stock pushed just a little bit above the resistance line that connects all the key peaks since early August.
- Still, any pullback wouldn’t mean much until Lennar shares broke below their 20-day moving average line, plotted in blue. The floor that aligns all the key lows since August is also right at that level.

As of this writing, James Brumley did not hold a position in any of the aforementioned securities. You can learn more about James at his site, jamesbrumley.com, or follow him on Twitter, at @jbrumley.