
In retrospect, Monday’s modest gain may have only been a setup for an even more dramatic tumble on Tuesday. Stoked by fears surrounding a potential impeachment effort, poor PMI numbers for September and calendar-driven profit-taking, the S&P 500’s 1.23% selloff dragged it below some important technical support. The market’s true direction here remains a mystery.
Shares of Charles Schwab (NYSE:SCHW) and TD Ameritrade Holding (NASDAQ:AMTD) led the charge, falling 10% and 26%, respectively, after Schwab announced it would roll-out commission-free online and mobile trading. It’s widely expected its rivals will follow suit. E*trade Financial (NASDAQ:ETFC) took a big hit too, sliding more than 16% lower.
There were a handful of winners, such as Stitch Fix (NASDAQ:SFIX). Shares of the online-stylist advanced a little more than 4% after the company’s fiscal Q4 earnings figure came in better than expected. There just weren’t enough names like SFIX to keep stocks out of the red. The NYSE’s decliners outpaced advancers by three-to-one.
Headed into Wednesday’s session, it’s the stock charts of Twitter (NYSE:TWTR), Synchrony Financial (NYSE:SYF) and Valero Energy (NYSE:VLO) that merit the closest examination as trading prospects. Here’s why.
Synchrony Financial (SYF)
To point out Synchrony Financial took a sizeable loss on Tuesday doesn’t mean a whole lot; most stocks took big hits. The overall market tide spread its carnage around pretty indiscriminately.
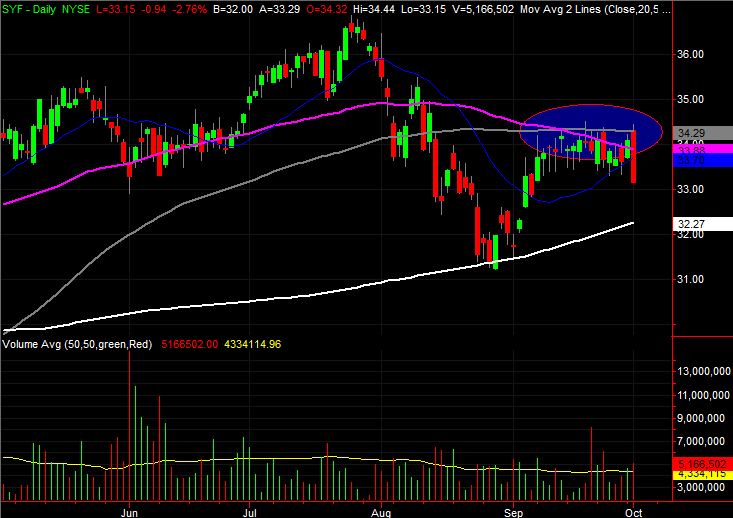
But, SYF stock is still worth a closer inspection simply because of the nature and placement of yesterday’s 2.8% setback. It’s the most indicative of bearish possibilities for a handful of different reasons.

Click to EnlargeOne of the biggest of those reasons is yesterday’s “outside day,” where the open is above the prior day’s high and the close is below the previous day’s low. The big and sweeping change of heart in the middle of the session is telling.- Underscoring the sweeping nature of the stumble is the fact that it took shape after another failed effort to push above the gray 100-day moving average line. SYF stock has been trying, to no avail, to clear that technical ceiling for a couple of weeks now.
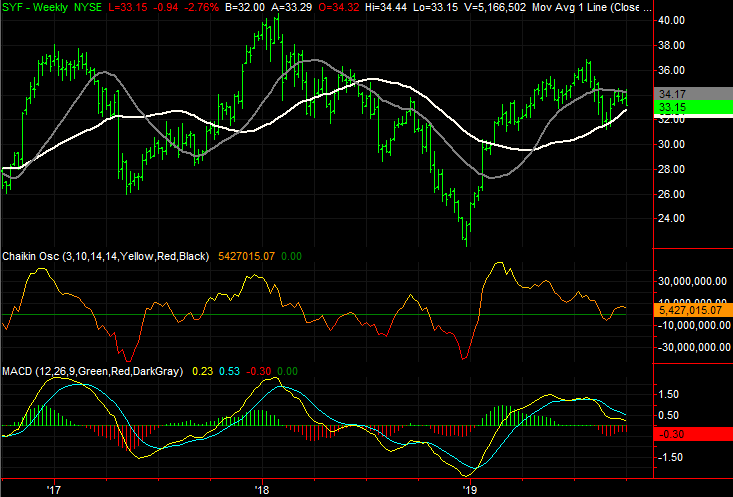
- Zooming out to the weekly chart it becomes clear that Synchrony Financial shares are no stranger to major up and down swings. It would be surprising if this one didn’t materialize and looked like what happened in 2018 and early 2017.
Valero Energy (VLO)
A cursory look at Valero Energy shares is a little bit daunting. Although it couldn’t be stopped in 2018 and early 2018, it was pounded into submission late last year. This year’s choppiness hasn’t re-inspired confidence, and investors are especially nervous about energy names right now anyway.
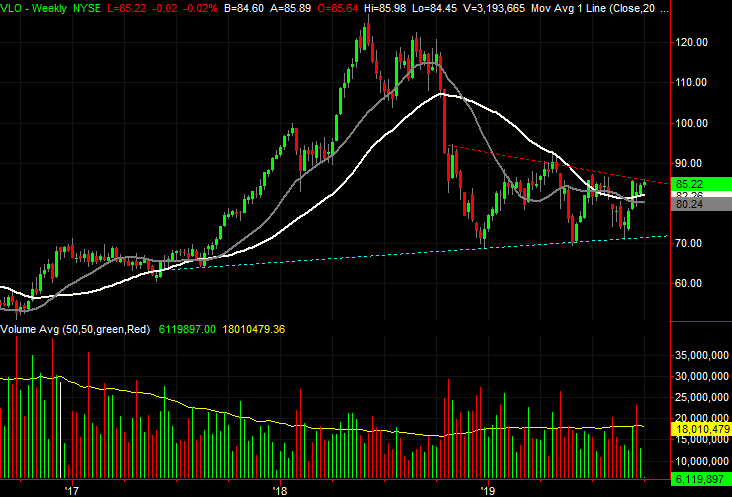
A longer, more thorough look at both stock charts suggests there’s something to this year’s choppiness besides uncertainty though. The volatility is extremely well organized, suggesting there’s a crowd of would-be buyers waiting in the wings to see the official trigger. Other bullish clues have surfaced in the meantime.

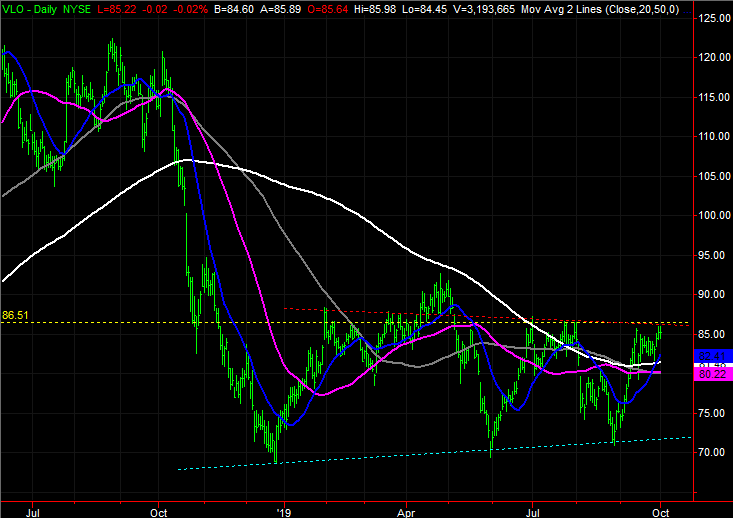
Click to EnlargeThat “organized” action is primarily a wide and barely converging wedge shape, framed by blue- and red-dashed lines on both stock charts. Getting above the upper boundary would serve as a bullish catalyst.- It’s subtle, but notice how even the white 200-day moving average line is now pointed in an upward direction. It’s a hint that the undertow is bullish in every key timeframe.
- The clincher here would be the purple 50-day line moving above the white 200-day moving average line. Although that still leaves open the possibility of a small pullback before a breakout thrust materializes, that would significantly bolster the bullish case.
Twitter (TWTR)
Credit has to be given where its due. Before 2017, it wasn’t clear Twitter was going to be able to remain a viable entity on its own. CEO Jack Dorsey found the right chemistry starting in 2017 though, and turned the company — and TWTR stock — around. It wasn’t a straight-line recovery, but it was a recovery nonetheless.
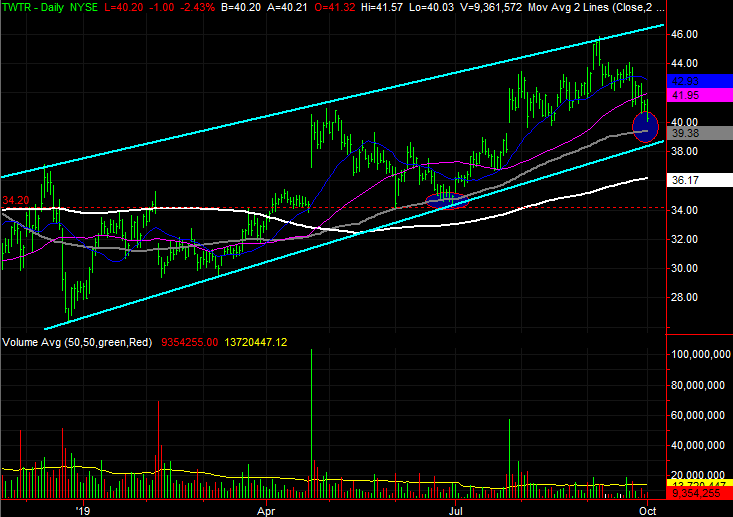
This year’s bullishness has been part of said recovery. It has also been unusually choppy, but that back-and-forth has been polite enough to flesh out some rising support and resistance lines. It’s worth a look at Twitter today simply because the lower edge of the range is about to be tested again, along with another important support line.
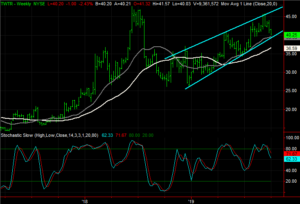
Click to EnlargeThe floor in question is the lower of the two blue lines plotted on both stock charts, tagging most of the major lows going back to late-2018. The gray 100-day moving average line also has a chance at serving as support.- Should either of the most plausible floors break, the next-best possibility for support is just above $34, marked with a red dashed line on the daily. That’s where a floor was found a few times in Q2.
- Working in the stock’s, and the bulls’ favor, there is a clear lack of volume behind any of the recent swoons (although the rebounds have been low-volume moves a well).

As of this writing, James Brumley did not hold a position in any of the aforementioned securities. You can learn more about him at his website jamesbrumley.com, or follow him on Twitter, at @jbrumley.