
Thursday was a back-and-forth session, but by the time the closing bell rang, the bears were on top. The S&P 500 ended the session down 0.24%, and still very much on the fence.
UnitedHealth Group (NYSE:UNH) was one of the key reasons stocks couldn’t stay in the black. Shares fell another 3%, logging its lowest close in over a year, with investors increasingly worried that an Elizabeth Warren Presidency could adversely impact healthcare players. Newcomer Peloton Interactive (NASDAQ:PTON) didn’t do as much net damage in its trading debut on Thursday, but shares fell more than 11% from their IPO price.
They weren’t all losers though. Beyond Meat (NASDAQ:BYND) jumped more than 11% after announcing fast food giant McDonald’s (NYSE:MCD) would be offering a meatless patty option at its restaurants.
None of those stocks are particularly great trading prospects headed into Friday’s session, however. Instead, it’s the stock charts of Vertex Pharmaceuticals (NASDAQ:VRTX), HollyFrontier (NYSE:HFC) and Conagra Brands (NYSE:CAG) that merit the closest looks.
Vertex Pharmaceuticals (VRTX)
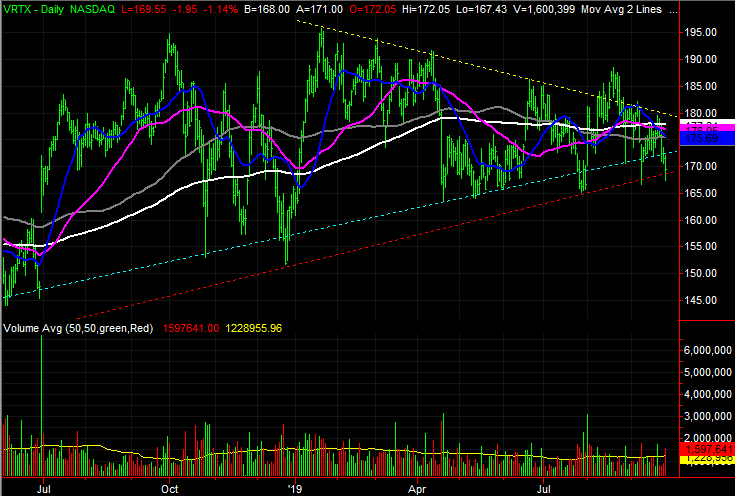
The last time we took a technical look at Vertex Pharmaceuticals back on Aug. 27, it was toying with a breakout above the upper boundary of a converging wedge pattern. In fact, it had temporarily pushed above that level, and was hinting at crawling back above it again. That second wind was likely to be the one to remain in motion, given how the streak of higher lows was still intact.
That never happened. In fact, VRTX stock has rolled back to the lower boundary of that converging wedge pattern and is one more bad day away from snapping that floor. If that happens, big trouble could ensue.
Click to EnlargeThe make-or-break line in question is the ceiling that connects most of the consecutively lower highs since the beginning of the year. It’s marked in yellow on both stock charts.- Yesterday’s low of $167.43 kissed a long-standing support line that serves as the lower edge of the converging wedge shape. It’s marked as a red dashed line on both stock charts.
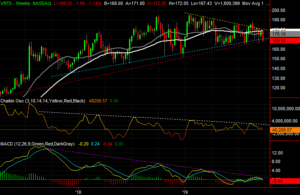
- Although it popped above a technical ceiling last month and has logged a long string of higher lows, each peak of the weekly chart’s Chaikin line and MACD lines says Vertex has been losing steam for months.

HollyFrontier (HFC)
Energy stocks are doubly tough to handicap. Not only are they pushed and pulled by typical forces that work for and against any other names, the ebb and flow of crude and gas prices are also factors. HollyFrontier is no exception to this exaggerated challenge.
Still, the underlying clues that take shape on a stock chart still point the way for what likely lies ahead. HFC stock is no exception to that that norm either. That’s what makes what happened this week so exciting, as well as what’s about to happen.
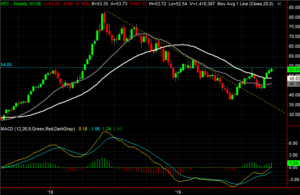
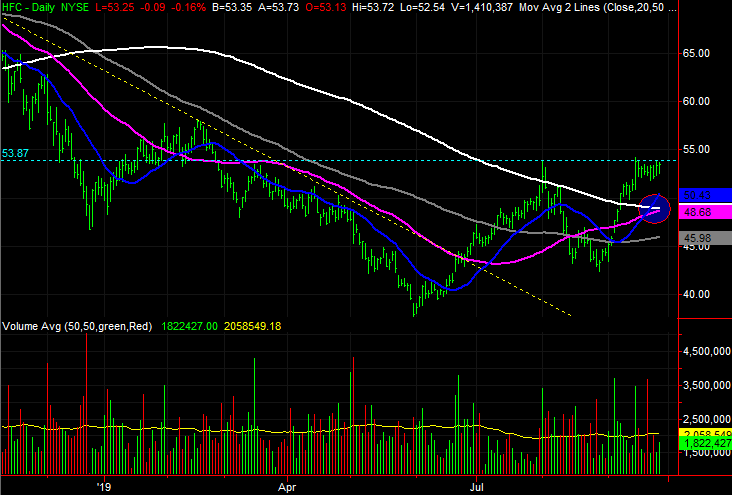
Click to EnlargeHollyFrontier shares snapped out of a downtrend in July, by virtue of breaking above a falling resistance line that extends back to the mid-2018 peak. It’s marked in yellow on both stock charts.- Although HFC has made a higher low, it has not yet made a higher high. Failure to do so, however, has also made it clear that there’s a technical ceiling taking shape at $54.
- It’s not in place quite yet, but we’re getting close to a so-called “golden cross” where the purple 50-day moving average line moves above the white 200-day line. It’s an important buy signal.

Conagra Brands (CAG)
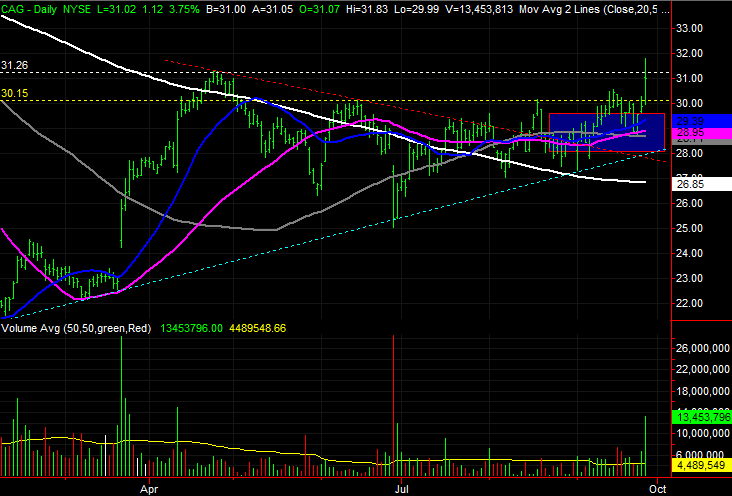
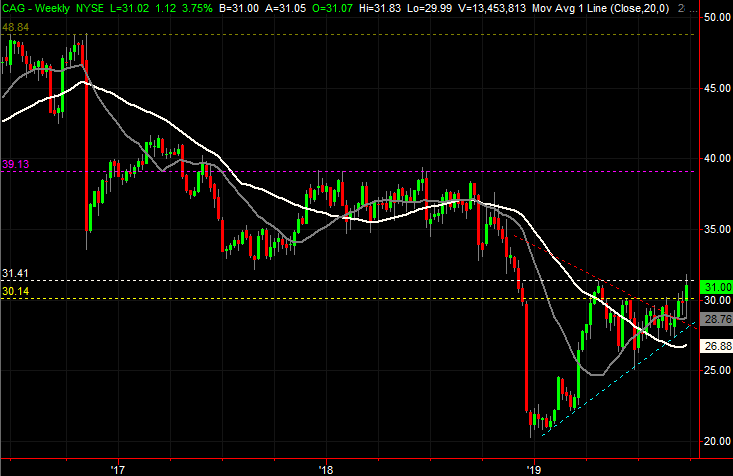
A couple of weeks ago, Conagra Brands was knocking on the door of a major technical breakout. It wasn’t up and over the hump yet, but was near it, and had logged repeated efforts to do so. It looked to be just a matter of time.
That time came yesterday … almost. CAG poked above that resistance in a big way, but only for a short while. Nevertheless, the bulls tipped their hand, and they did so with the ideal backdrop. The bears may push back a little from here, but the bulk of the heavy lifting has arguably already been done.
Click to EnlargeThe ceiling that was of the most concern is right around $30, plotted in yellow on both stock charts. But, the April peak near $31.20 in April is also worth watching. Conagra was only briefly above that line on Thursday.- This is a healthy, well-paced move though. Notice how CAG stock is pushing up and off of three key moving average lines as of this week (highlighted). That launchpad bolsters the breakout case.
- Should this budding breakout actually get going, the next most plausible target is around $39, where Conagra shares found resistance repeatedly during the first half of last year.
As of this writing, James Brumley did not hold a position in any of the aforementioned securities. You can learn more about him at his website jamesbrumley.com, or follow him on Twitter, at @jbrumley.