
-
Bullish sentiment for gold has retreated from the 95% level, and is back to a more balanced level at 52% bulls.
-
Previous short-term sell signals in gold have seen 5.5% corrections at a minimum, and average corrections of 7.1%.
-
Based on the current correction sitting at only 3.8%, I would expect gold to break its recent lows at a minimum before this correction is over.
It was just three weeks ago that animal spirits were running wild in the metals complex, and analysts were trotting out $2,000/oz gold price targets for 2020. Generally, when everyone is in the pool and having a great time counting their chips, the next couple of months are much less enjoyable. This is precisely what we’ve seen so far in the gold market, with the metal now down 3.8% off of its highs, and some of the over-leveraged bulls busy licking their wounds. While this has been a step in the right direction for sentiment and returning the market to balanced, a 3.8% correction from the highs is generally not enough to get the bulls running for cover. In past instances, we have seen sharper corrections after sentiment sell signals and an average correction of 7.1%. Based on this, I do not believe this correction is over just yet, and I expect gold to head to the $1,470/oz or lower before the odds slide back in the bulls favor.
History does not always repeat itself, but it does often rhyme, and this is why it’s always worth studying history carefully. In the past ten years, there have been four instances when bullish sentiment for gold headed into the extreme exuberance zone. This zone is an area where we have four bulls for every one bear from a sentiment standpoint for a length of over 100 calendar days. This prolonged push in one direction for sentiment often takes time to unwind, and this generally requires at least a two-month correction before new highs can be made. If new highs are made in the interim, they are rarely ever sustainable. The below chart shows these past instances, where the red line moves into the red box at the top of the chart I’ve built:
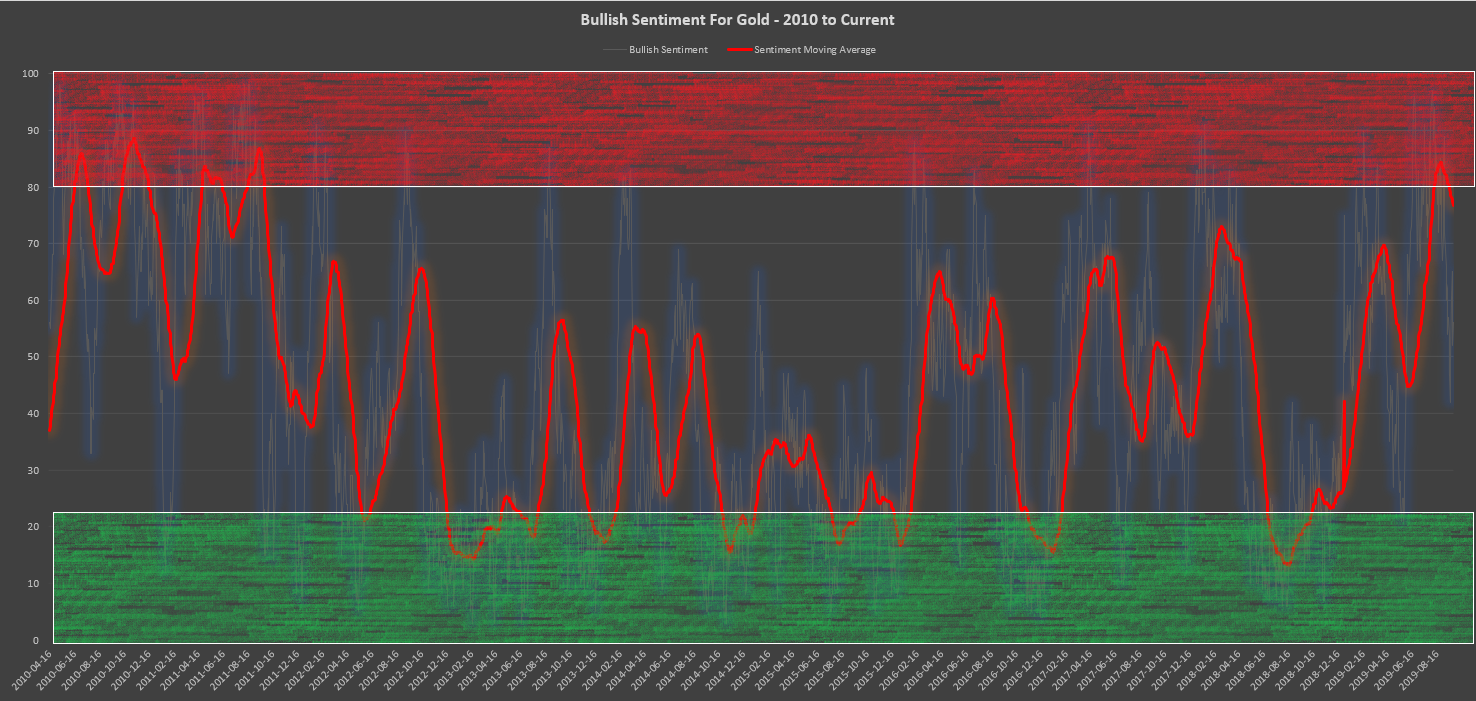
(Source: Daily Sentiment Index Data, Author’s Chart)
As we can see from the above chart, the last four times we headed into this zone were June of 2010, October of 2010, April of 2011, and August of 2011. The latter case marked a long-term top in gold, but I am excluding this case from this study as I do not believe we are showing any technical similarities to this case currently. While anything is possible, I would argue that the chance of a long-term top here is less than 15%, and not worth entertaining. Let’s zoom in and see how the other three cases played out:
In June of 2010, gold topped out at $1,265/oz, had a 5% correction and tried to bottom, but ultimately broke lower to bottom out a month later at $1,158/oz. This marked an 8.5% correction for gold from peak to trough.

(Source: TradingView.com)
In October of 2010, gold topped out at $1,387/oz and immediately saw a 5.5% correction. The metal then made two marginally higher highs over the next three months but endured two more corrections of 6.8% and 8.5% from these highs. Ultimately, gold traded in a frustrating range for over five months before heading to new highs.
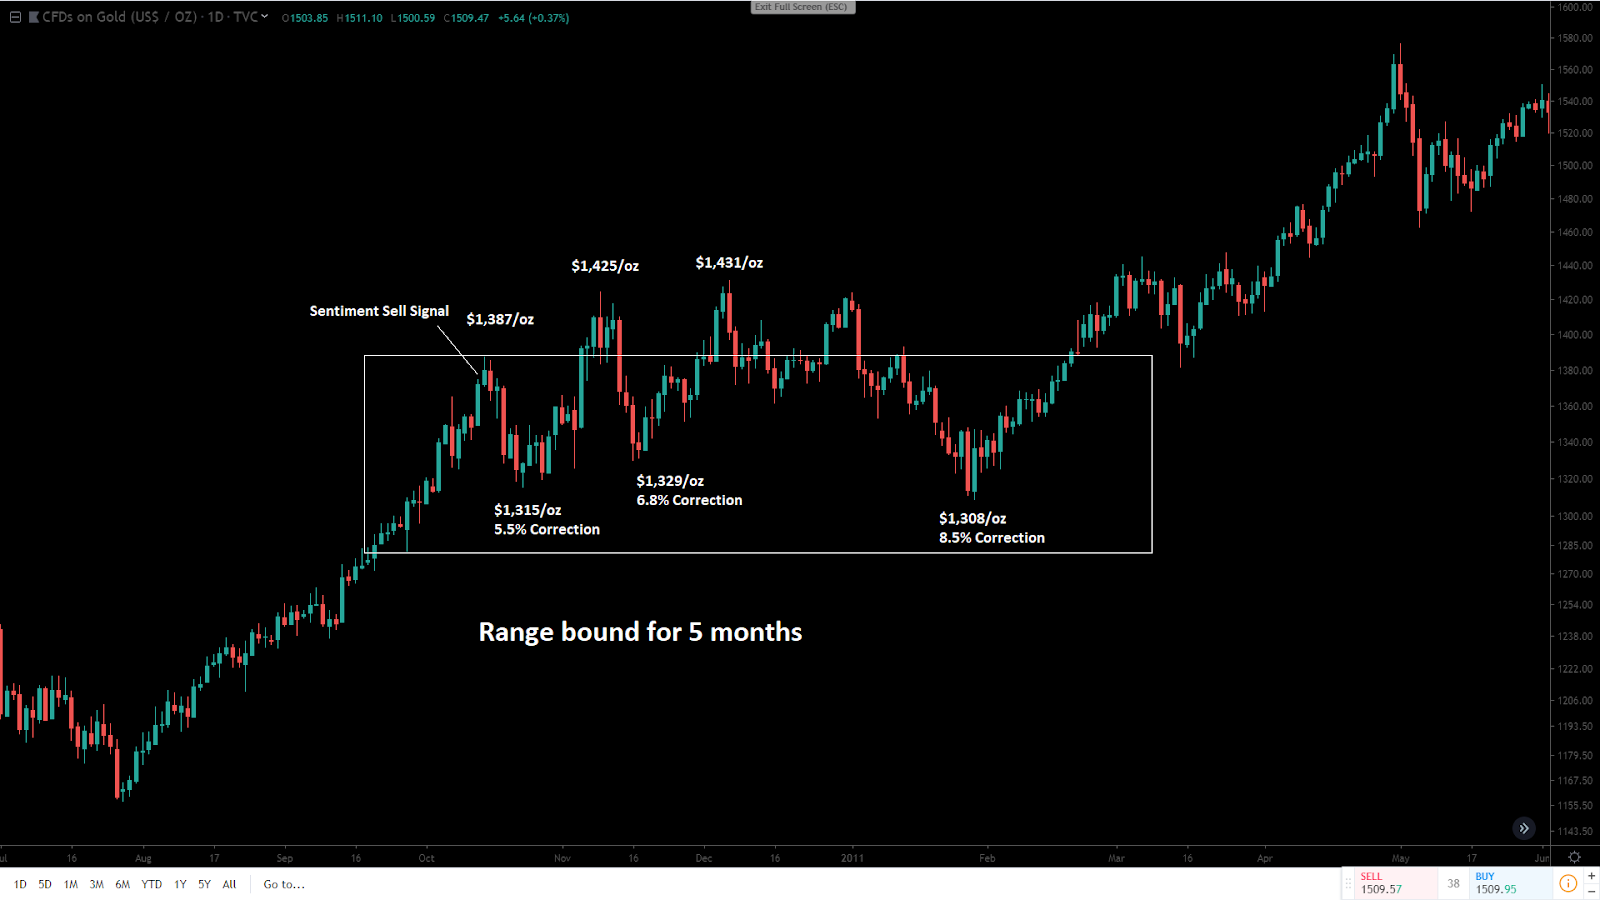
(Source: TradingView.com)
Finally, in the April 2011 correction, the lows were made very quickly, but the drop was very steep. Gold lost 7.2% in just four trading days and then spent another two months chopping around before making new highs.

(Source: TC2000.com)
So what can we glean from these prior occurrences?
First, the good news, gold made higher highs within six months on all occasions. Second, the bad news, corrections averaged 7.1%, and the minimum correction was 5.5% after these sell signals. Also, any new highs in the next two months faced heavy selling pressure and failed. Let’s look at how this would translate to the current picture:
As we can see below, gold is 3.8% off of its highs, and if it were to trade in line with the minimum, we would see a correction down to $1,478/oz. If we were to correct in line with the average, we would see a correction down to $1,454/oz. If we were to correct down to the worst case, we would see a correction down to $1,432/oz. In addition, any new highs in the next two months have a high probability of being rejected. Given this information, I see no reason to rush in and start new long positions yet. The low for gold for this correction will likely fall somewhere between $1,430/oz and $1,470/oz, and we are currently trading at a gold price of $1,510/oz.
The good news for the bulls is that higher highs are likely ahead in 2020. The bad news is that a lower low below the recent low at $1,506/oz seems highly likely. Rather than rush in, I believe patience is still the best course of action here. The next strong support level comes in at $1,420/oz, and I believe this would present an opportunity to buy with both hands if we head down here.
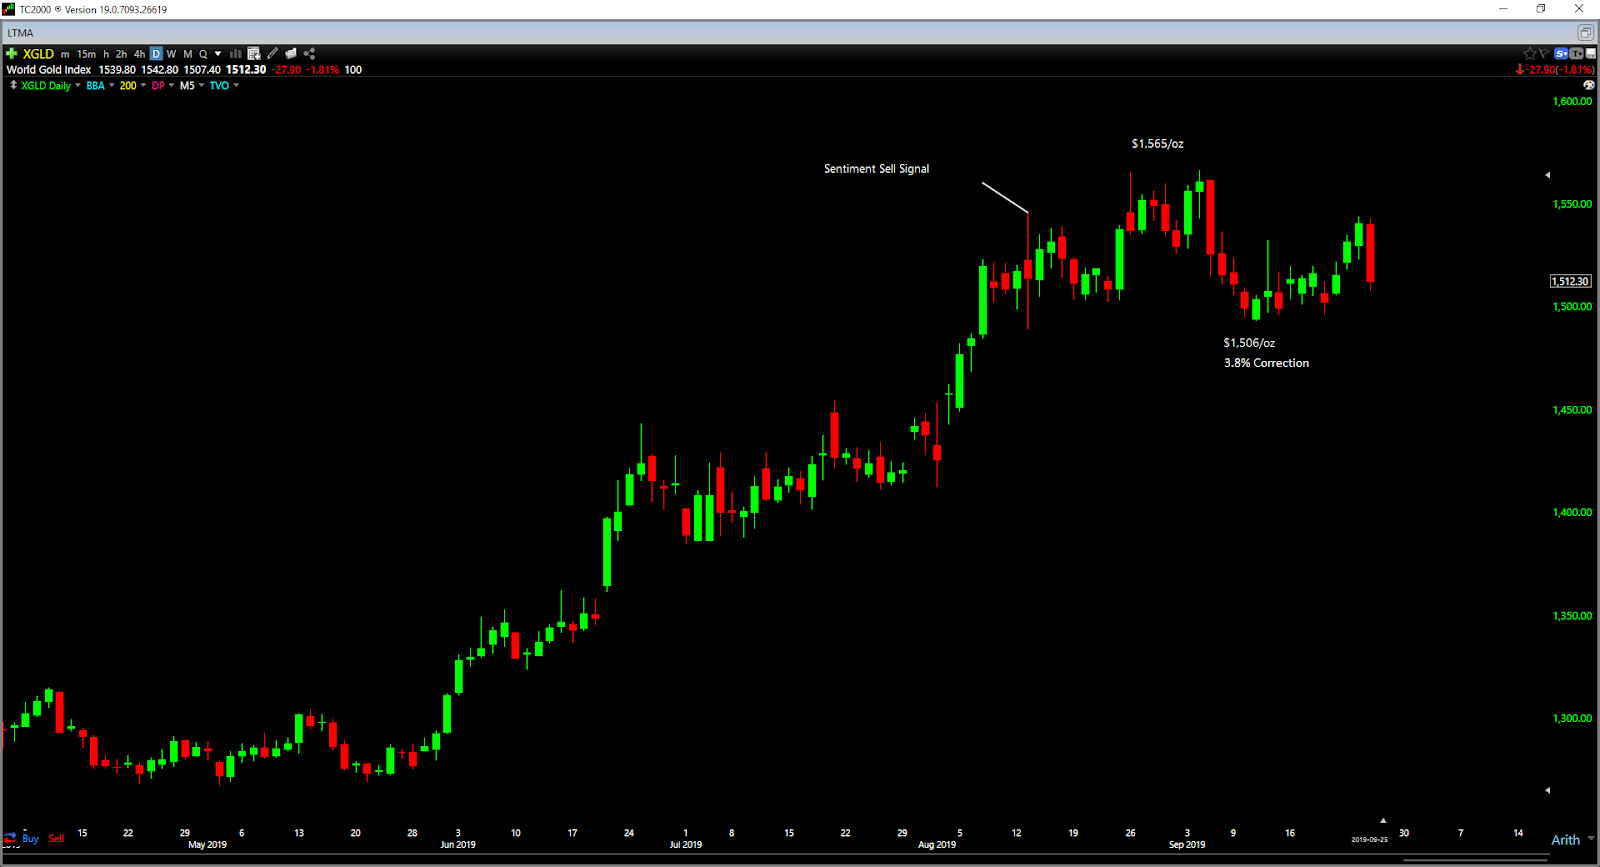
(Source: TC2000.com)
The SPDR Gold Shares (GLD) was trading at $142.28 per share on Thursday morning, up $0.45 (+0.32%). Year-to-date, GLD has gained 15.07%, versus a 11.40% rise in the benchmark S&P 500 index during the same period.
GLD currently has an ETF Daily News SMART Grade of B (Buy), and is ranked #1 of 33 ETFs in the Precious Metals ETFs category.
About the Author: Taylor Dart
 Taylor Dart has over 10 years of experience in active & passive investing specializing in mid-cap growth stocks, as well as the precious metals sector. He has been writing on Seeking Alpha for four years, and managing his own portfolios since 2008. His main focus is on growth stocks outperforming the market and their peers. In addition to looking at the fundamentals, he uses different timing models for industry groups, and scans upwards of 2000 stocks daily to identify the best fundamental opportunities with the timeliest technical setups. Taylor is a huge proponent of Trend Following and the “Turtles” who enjoyed compound annual growth rates of over 50 percent per year..