
After a lethargic start, some encouraging commentary on the future of international trade lifted stocks out of the doldrums on Tuesday. The S&P 500 ended the day at 3,005.7, up 0.26%, though the gain was made on light volume.
Snap (NYSE:SNAP) was one of the key drivers of that progress. The Snapchat parent’s stock jumped nearly 7% after Susquehanna analyst Shyam Patil upped his stance on the company from “Negative” to “Neutral.” A much bigger Corning (NYSE:GLW), however, was one of the key reasons the broad market didn’t fare better. Shares of the industrial tech outfit fell more than 6% after lowering its sales guidance for the quarter now underway.
As for the names worth a closer look headed into Wednesday’s session, however, the stock charts of Global Payments (NYSE:GPN), Valero Energy (NYSE:VLO) and Discovery (NASDAQ:DISCA) stand out. Here’s what’s most interesting about each.
Discovery (DISCA)
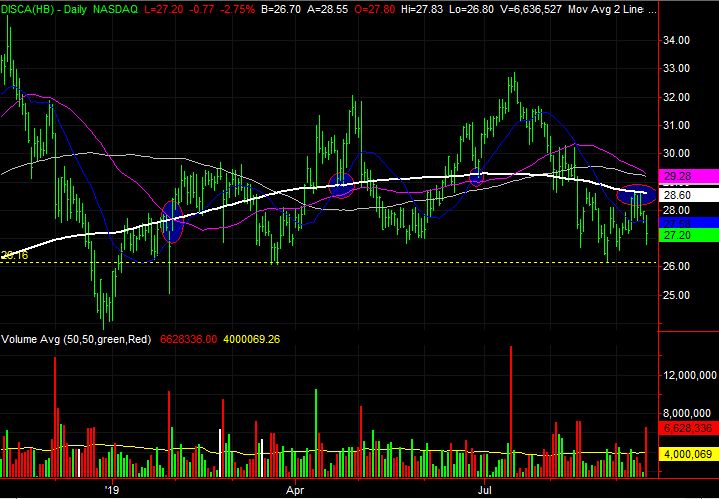
With nothing more than just a quick glance, Discovery shares look like they’re trapped in a choppy, sideways range. And, perhaps that’s all it is. A more critical and longer-term look at the action that has taken shape over the course of the past couple of years, however, suggests DISCA stock is alarmingly vulnerable to more downside. It just needs one more good nudge to push it over the edge of that cliff.
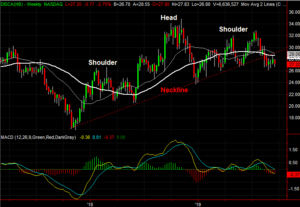
Click to EnlargeIt’s subtle, but it’s too reliable to ignore now. That is, the 200-day moving average line plotted in white on both stock charts has been a key support and resistance level. Last week, it was major resistance.- Zooming out to the weekly chart we can see a glimpse of a head-and-shoulder pattern, with a neckline that was broken in the middle of last month. Once the neckline is broken, the stock in question should theoretically fall the same distance between the neckline and the top of the head.
- The last bastion of hope for the bulls is that the recent floor around $26.16, plotted in yellow on the daily chart, continues to hold up as support.

Global Payments (GPN)
It was news that sparked the volatility in shares of Global Payments yesterday. The European Union has given permission to the payments middleman to acquire Total System Services (NYSE:TSS). As such, some traders expect Tuesday’s volatility will have passed by Wednesday. And, perhaps it will.
Sometimes, however, it’s news that triggers a pent-up technical move that’s simply waiting on the right catalyst. If that’s the case here for GPN, traders may want to brace for a sizeable pullback.

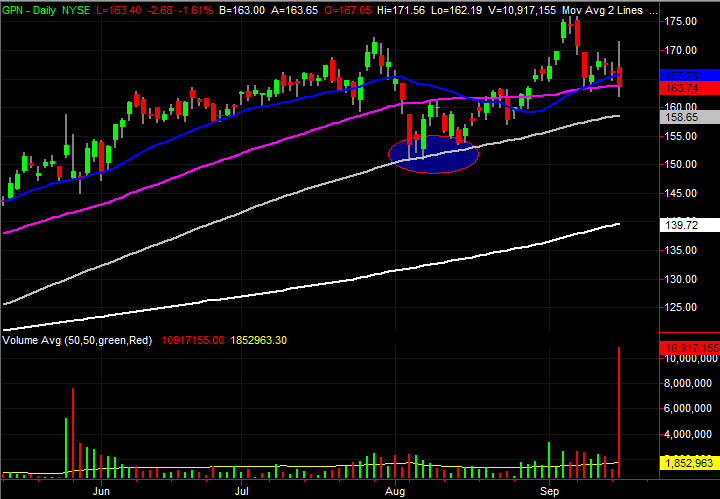
Click to EnlargeThe shape of the bar itself is key. Despite a decent start and an early move to a big gain, by the time the closing bell rang, the stock was below Monday’s low. This “outside day” reversal suggests a sweeping change of heart often seen at major pivot points.- Yesterday’s volume spike also suggests a transition from a net-buying to a net-selling environment.
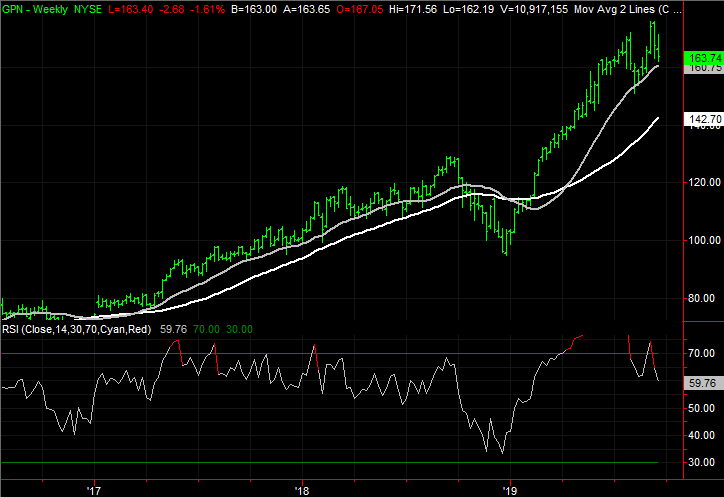
- The weekly chart’s RSI line illustrates just how overbought Global Payments was, and still is. That same chart also underscores how important the 100-day moving average line, marked in gray on both stock charts, is as a technical floor.
Valero Energy (VLO)
Finally, topping with an energy stock right now can be a tricky game. Aside from being something of a political pawn and clearly subject to even threats of disruption, the true depth of global demand is fuzzy as the world works towards alternative energy sources.
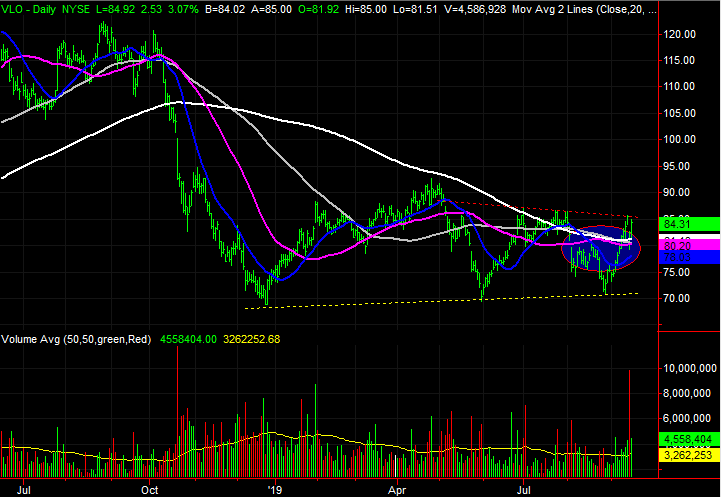
To the extent one can trust the chart of any oil and gas name at this time though, Valero Energy is dropping some interesting hints. One more bullish “oomph” could get shares up and over a recently developed hurdle and start a major recovery of last year’s major meltdown.
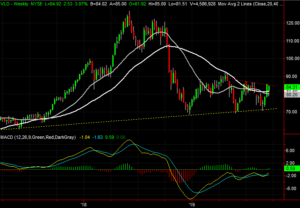
Click to EnlargeThe hurdle in question is the line that connects all the recent peaks since the beginning of July, marked in red on both stock charts.- Fueling the range-bound action that set up this consolidation is a floor that not only connects the key lows since late last year, but extends back to early 2018. It’s marked in yellow on both stock charts.
- Tilting the scales in a bullish direction is the way the moving average lines have converged after a wide divergence. If history repeats itself, they’ll start to diverge again, starting with the purple 50-day moving average line’s cross above the white 200-day line … a so-called “golden cross” that often portends prolonged bullishness.

As of this writing, James Brumley did not hold a position in any of the aforementioned securities. You can learn more about James at his site, jamesbrumley.com, or follow him on Twitter, at @jbrumley.