
The market didn’t end yesterday’s session at its high, but the 0.29% gain the S&P 500 was able to hang onto still translates into the third-straight winner. The Dow Jones Industrial Average logged its seventh consecutive win, with both indices still buoyed by renewed hopes that trade ties with China are on the verge of improving.
Overstock.com (NASDAQ:OSTK) led the charge with its 17% advance. Shares of the e-commerce platform continued the rally spurred by an upgrade from D.A. Davidson tendered earlier this week. Advanced Micro Devices (NASDAQ:AMD) offered up a meaningful helping hand too, gaining 1.5% because it’s one of the more pronounced beneficiaries of a more accommodating trade environment.
Holding the market back more than any other was Oracle (NYSE:ORCL), down 4.3% in response to last quarter’s lackluster revenue growth, which was underscored by the announcement that Co-CEO Mark Hurd will be taking medical leave to attend to an unnamed health-related matter.
None of those names are particularly well-suited trading prospects headed into today’s action, however. Instead, take a look at the stock charts of Electronic Arts (NASDAQ:EA), Centurylink (NYSE:CTL) and Wynn Resorts (NASDAQ:WYNN). Here’s why.
Centurylink (CTL)
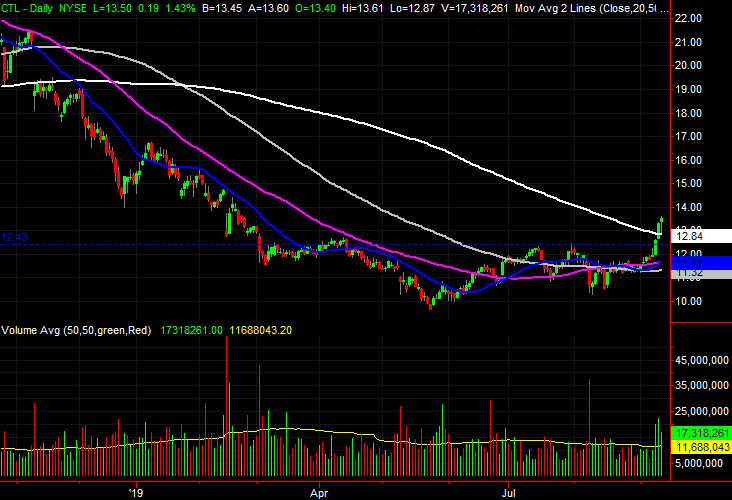
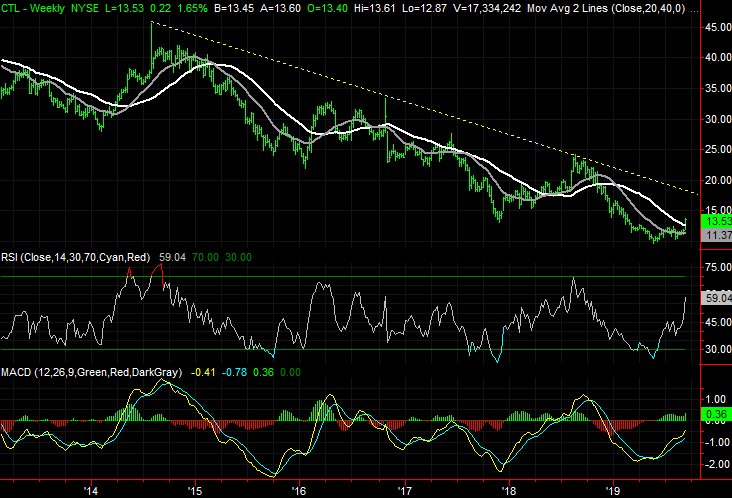
A little over a month ago, Centurylink was featured as a noteworthy name thanks to a repeated effort to break past a major technical ceiling. Although not yet over that hump, a string of higher lows and improving technical support suggested such a move was only a matter of time.
That happened, in spades. In fact, the sheer speed of the breakout was enough to push CTL stock beyond another major technical barrier. Although now overextended and ripe for some profit-taking, the entire sequence of events says the path of least resistance is now upward.

Click to EnlargeThe ceiling at $12.43, plotted in blue on the daily chart, was the technical ceiling in question. Centurylink peaked there twice in July, but didn’t flinch at that level earlier this week.- The strength of the move carried CTL stock past the 200-day moving average line as well, marked in white on both stock charts. The whole move also unfurled on above average volume.
- Although ripe for a pushback, the fact that the 20-day moving average line is now above the purple 50-day line, and the fact that the 50-day line is above the 100-day moving average line is telling. Any stumble should be short-lived.
Wynn Resorts (WYNN)
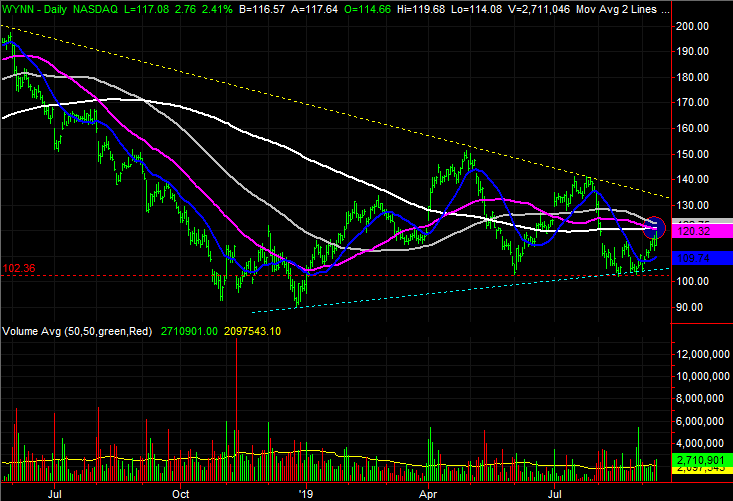
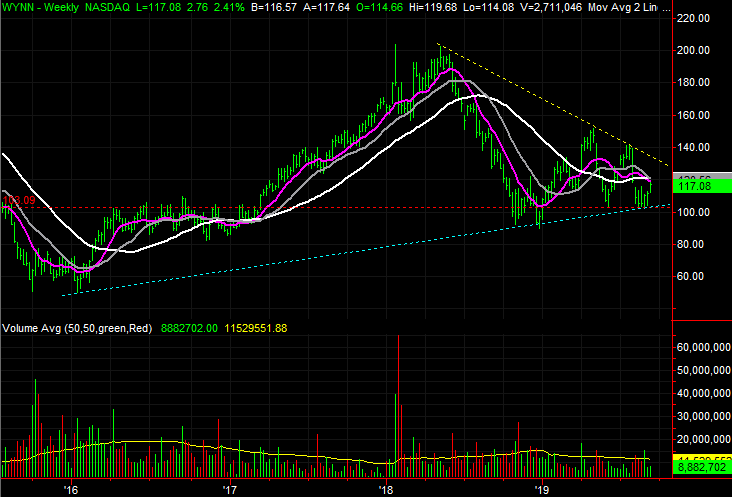
After a rough 2018, a choppy 2019 is a relative win for Wynn Resorts. Technical support around $103, marked as a red dashed line on both stock charts, gets much of the credit for escaping would could have turned out to be a move to lower lows.
There may still be trouble ahead, however, despite the bullishness we’ve seen so far this month. WYNN stock is already slowing as it nears what’s known to be major resistance, and another clue says the damage has already been done.

Click to EnlargeThe resistance line in question is the convergence of the purple 50-day moving average line and the white 200-day moving average. Wynn Resorts shares only had to get near them on Thursday to start peeling back.- Simultaneously, the 50-day moving average line has now crossed back under the 200-day moving average. This so-called “death cross” is a hint that the bigger-picture undertow is bearish despite the recent gains.
- Even if the rally isn’t quelled here, there’s another impending ceiling. The yellow dashed line that connects the key peaks going back to the early 2018 high could still stop the advance.
Electronic Arts (EA)
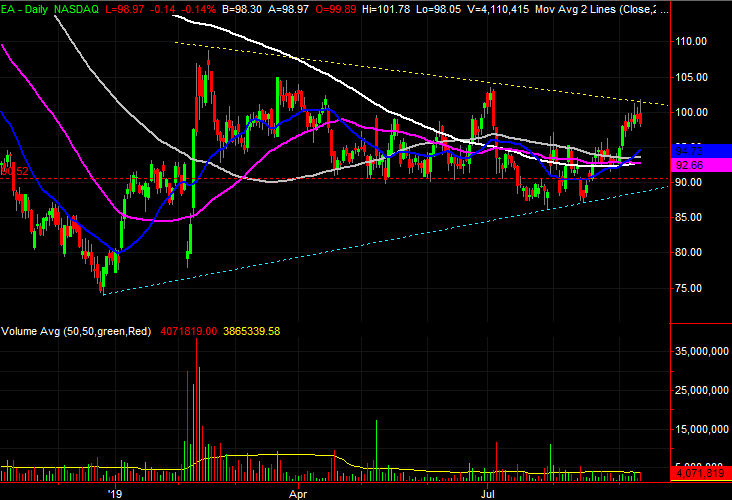
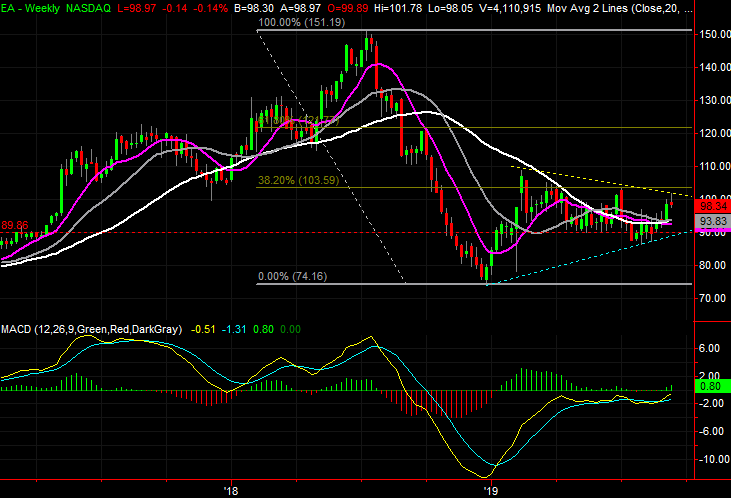
Finally, the implosion Electronic Arts shares suffered last year hasn’t persisted into this year. In fact, EA stock looks like it’s been trying to stage a full recovery of that meltdown.
It hasn’t done that yet, and may never actually do so. There are several major clues that suggest that rebound is more likely than not though. And, the chart has drawn some clear lines in the sand that will make clear if and when the stock moves into full-breakout mode.

Click to EnlargeThe most important line in the sand is the line that connects the lower highs seen since February’s peak, plotted in yellow on both stock charts. This week’s lull makes clear traders are hesitant to push past it.- Nevertheless, the convergence of all the key moving averages since June is bullish in and of itself. Better still, we’re close to seeing a renewed bullish cross where the purple 50-day line moves above the 200-day moving average.
- It’s also not likely to be a mere coincidence that the area standing in the way of more upside lies right around a Fibonacci retracement line near $103. Moving above it should also be catalytic.
As of this writing, James Brumley did not hold a position in any of the aforementioned securities. You can learn more about him at his website jamesbrumley.com, or follow him on Twitter, at @jbrumley.