
For the first time in over a week, the market moved the same direction two days in a row. The S&P 500 made a 1.27% gain on Thursday, though that still leaves it below the key 50-day moving average line. The volume behind the advance wasn’t exactly thrilling either.
Computer company Dell Technologies (NYSE:DELL) took the lead, gaining more than 3% during the regular-hours session in front of earnings, and then jumping more than 9% in after-hours action after reporting an earnings beat after the closing bell rang.
Holding the market back more than any other name was Fastly (NYSE:FSLY). Although it rallied more than 2% after the closing bell rang, that move didn’t even come close to offsetting the stock’s 12.5% setback during the normal session … a move mostly prompted by profit-taking after an incredible runup since mid-August.
As for names worth a look as trading prospects headed into the long weekend though, take a look at the stock charts of Mylan (NASDAQ:MYL), Home Depot (NYSE:HD) and Newell (NASDAQ:NWL). Here’s what’s most noteworthy, and how that may point to what lies ahead.
Newell (NWL)
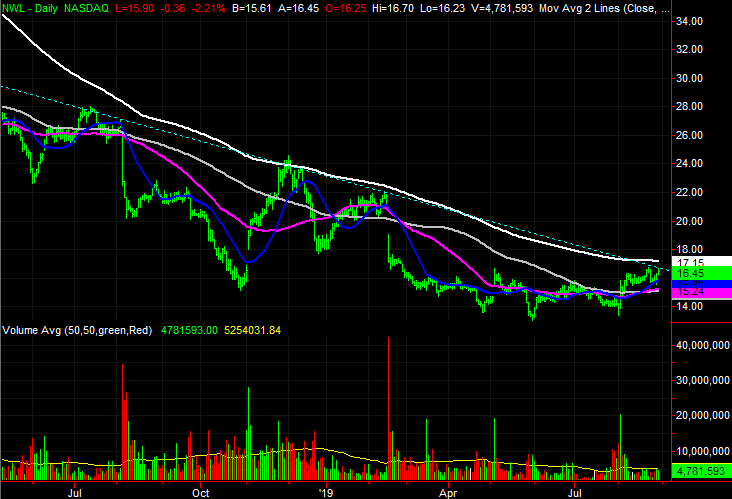
Newell shares have been fighting a losing battle since the middle of 2017. And, technically speaking, it’s still within the confines of a well-established downtrend.
On the other hand, thanks to a slow turnaround effort that started to take shape just a few weeks ago, NWL stock is close to snapping its way out of the slump. Just know that Newell has been in this condition before, only to be up-ended before it took off. But, this time it is shaping up a little bit differently.

Click to EnlargeThe upper edge of the bearish trend is the convergence of the white 200-day moving average line, and the dashed blue line that connects all the key highs going back to the beginning of last year.- Underscoring the budding bullish effort thus far is the fact that the Chaikin line is now back above zero, suggesting there’s a healthy amount of volume behind the current advance.
- If the prospective breakout ends up taking shape, the most plausible upside target is the 38.2% Fibonacci retracement level of $28.85. A move to that mark still wouldn’t be in a straight line though.
Home Depot (HD)
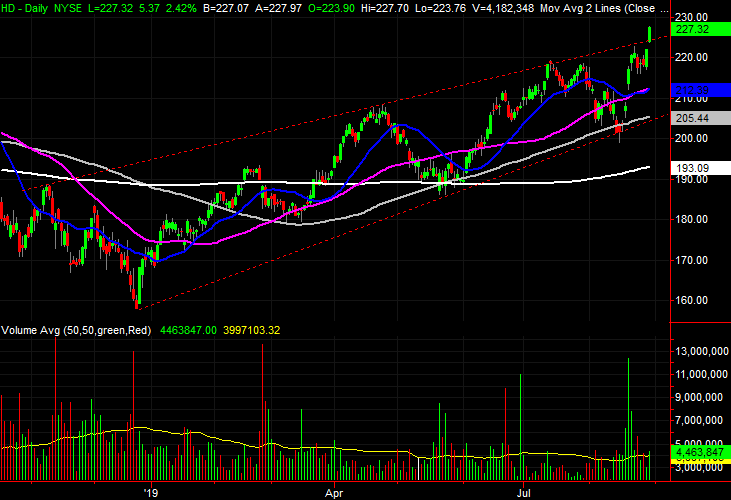
The past couple of weeks have been good ones for Home Depot, and things were particularly hot yesterday. Thursday’s 2% pop carried shares above a near-term ceiling, to bring the two-week advance to 13%. The move, however, also stopped right at another, more established technical ceiling.
That momentum is compelling to be sure, particularly given how it first took shape. But, the odds of there being any more upside left to dish out are pretty slim, given everything else evident on the chart.

Click to EnlargeThe rally appears to have been capped at the resistance level that aligns Thursday’s high with the peaks made in September and January of last year. It’s the upper of the two blue lines that frame the rising trading range marked on the weekly chart.- HD stock has also now punched through the upper boundary of a shorter-term trading range, marked by red dashed lines on both stock charts. This hints at a breakout, but the sheer scope of the advance thus far is unusually big.
- Underscoring the above-average odds of a pullback from here is the fact that the weekly chart’s RSI indicator is very near its overbought level.
Mylan (MYL)
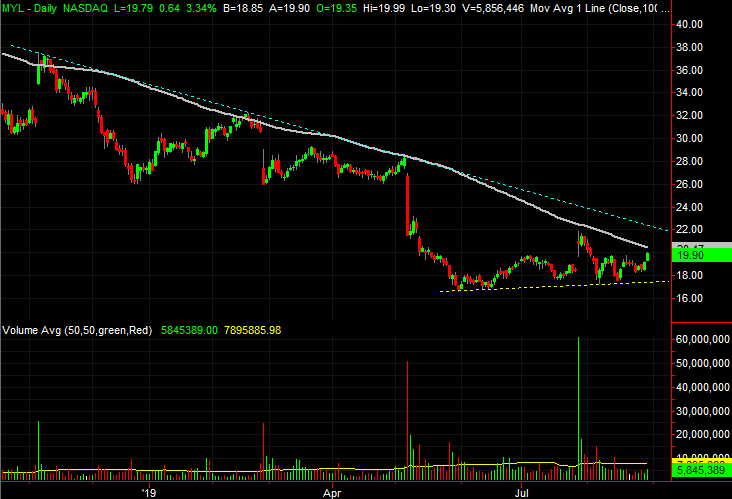
Finally, Mylan has been routed since the beginning of 2018. In fact, it looked downright unsalvageable in May thanks to a hard-hitting selloff.
In some ways though, that drubbing may have ultimately been the best thing for it. Although Mylan shares have yet to work their way back into a bullish mode — and are still far from it — the recent action suggests May’s meltdown may have served as a capitulation. Better still, the proverbial lines in the sand are pretty clear.

Click to EnlargeThe pinnacle line in the sand is the falling resistance line that connects all the peaks going back to January of 2018, marked in red on the weekly chart. It’s currently at $27, and falling fast.- Also note the gray 100-day moving average line is soon going to be tested as a technical ceiling. It has been a problem several times in the recent past, albeit not exactly.
- It’s small, but MYL stock has made a string of higher lows since May’s low, plotted with a yellow line. It’s the longest string of higher lows seen in well over year.
As of this writing, James Brumley did not hold a position in any of the aforementioned securities. You can learn more about him at his website jamesbrumley.com, or follow him on Twitter, at @jbrumley.