
-
One of the best ways to assess the health of a sector is by examining the Generals of the group.
-
I use nine of the highest market capitalization names within the Gold Miners Index and have termed them the Generals.
-
In this article, I examine how the group looks currently and what this means for the Gold Miners Index.
One of my favorite methods of analysis is taking a close look at the health of the most prominent companies in a sector to see how that sector is doing from a health standpoint. I call these stocks which are the highest market capitalization names in the group, “The Generals,” as the premise to this strategy is it’s difficult to win a war without the presence of the Generals. Just as Leonard T. Gerow, George Patton, Douglas MacArthur, Omar Bradley, George Marshall, and Bernard Montgomery (Britain) all had their instrumental roles in the defeat of the Axis Powers in WWII, the most prominent stocks in a group are required to lead and maintain an advance. The premise is that the fewer Generals that are present in battle or healthy, the less likely that an advance into enemy territory will be sustainable. The nine Generals I use to measure the health of the Gold Miners Index (GDX) are as follows: Barrick Gold (GOLD), Newmont Goldcorp (NEM), Agnico Eagle (AEM), Franco Nevada (FNV), Royal Gold (RGLD), Anglogold Ashanti (AU), Kinross Gold (KGC), Wheaton Precious Metals (WPM), and Kirkland Lake Gold (KL). Let’s take a look below:
As we can see from the first snapshot of Generals below, Barrick, Newmont Goldcorp, Agnico Eagle Mines, and Franco Nevada all broke out of 9+ month bases in late June. These significant breakouts have propelled the group higher, but of these four names, only Newmont Goldcorp is building a new base currently. The others all remain significantly extended from their prior bases, and likely need a breather at a minimum over the next few weeks.
(Source: TC2000.com)
Moving to the second snapshot of the Generals below, we can see more of the same. All of the below names broke out cup-shaped bases in June or July, and are now up multiple weeks in a row from their breakouts. As of right now, none of them have gone sideways for six weeks or longer, which is the minimum duration required to reset and build a new base. The path of least resistance is most likely higher, but not even the greatest companies in the world go up in straight lines. For this reason, the most likely path over the next 4-6 weeks is sideways or lower.

(Source: TC2000.com)
To summarize, all of the Generals remain in clear uptrends, but all of them except Newmont Goldcorp are extended miles past their most recent base structures. While the bigger picture looks higher long-term, short-term, the most likely scenario seems to be either a correction or sideways action. The reason for this is that these Generals have reached their targets from their prior bases, and now need a ‘reset’ for the next leg of their advance. If they were to continue to go higher from here without any base building, I believe this advance would be an opportunity to take profits. The reason for this is that institutions do not buy extended stocks, and therefore further appreciation from here without rest would be a move powered only by retail.
So does any of this line up with the Gold Miners Index? Let’s take a look:
As we can see from the Gold Miners Index below, the ETF is less than 4% from multi-year resistance at $31.05, and I would expect this area to be a brick wall on its first test. If the Generals were to continue higher over the next week, this might allow the Gold Miners Index to push up towards this significant resistance. Key support for the index sits at $25.70, which is more than 12% lower, and multi-year resistance is at $31.05, just 4% higher. For this reason, we have an asymmetric risk to reward here, and I do not see this as an ideal buying opportunity. Rather, I see any rallies above $30.00 as an opportunity to take some profits.
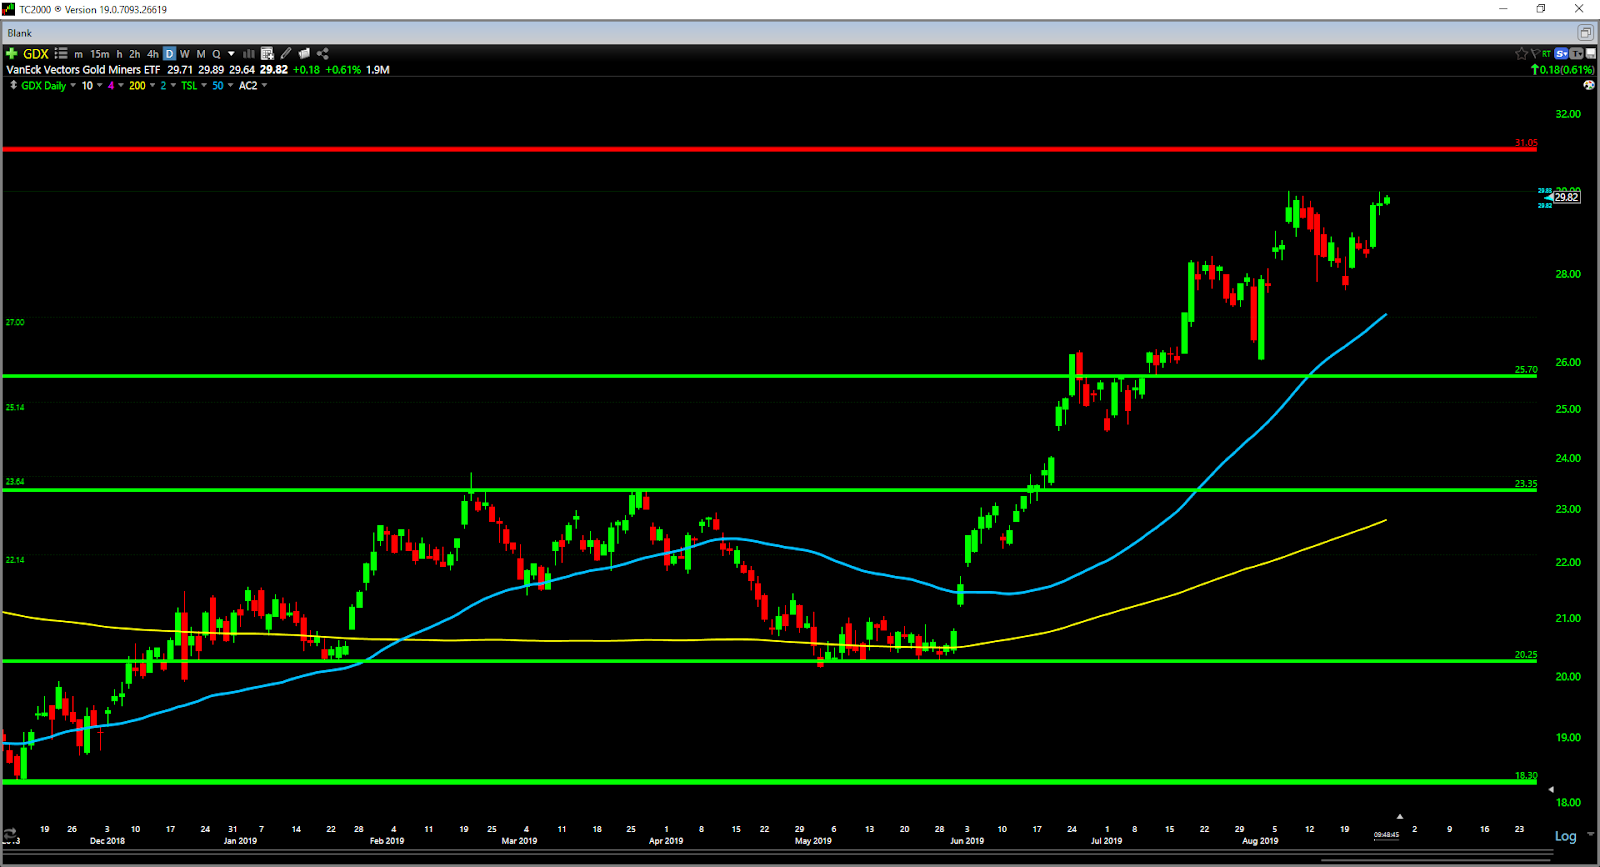
(Source: TC2000.com)
While the Gold Miners Index is likely setting up to blast through multi-year resistance at $31.05 later this year, I don’t expect it to succeed on its first test. I see the index as high-risk and low-reward here and would be using any rallies above $30.00 to take profits on the ETF. I believe there’s a high likelihood of a 10% correction in the index from the $30.00 – $31.05 level, and this will be the ideal time to reposition on the long side.
The VanEck Vectors Gold Miners ETF (GDX) was trading at $30.37 per share on Tuesday afternoon, up $0.73 (+2.46%). Year-to-date, GDX has gained 30.68%, versus a 8.07% rise in the benchmark S&P 500 index during the same period.
GDX currently has an ETF Daily News SMART Grade of C (Neutral), and is ranked #8 of 33 ETFs in the Precious Metals ETFs category.
This article is brought to you courtesy of ETFDailyNews.com.
About the Author: Taylor Dart
 Taylor Dart has over 10 years of experience in active & passive investing specializing in mid-cap growth stocks, as well as the precious metals sector. He has been writing on Seeking Alpha for four years, and managing his own portfolios since 2008. His main focus is on growth stocks outperforming the market and their peers. In addition to looking at the fundamentals, he uses different timing models for industry groups, and scans upwards of 2000 stocks daily to identify the best fundamental opportunities with the timeliest technical setups. Taylor is a huge proponent of Trend Following and the “Turtles” who enjoyed compound annual growth rates of over 50 percent per year..