Yesterday, I detailed five fundamental reasons why the stock market is sprinting into a big and powerful new bull market.
Long story short, inflation is crashing, the labor market is cracking, and financial stress measures are spiking – a potent combination which will inevitably force the Fed to end its rate-hike campaign. Whenever the Fed pauses a rate-hike campaign, it always sparks a stock market rally. The rally is especially big when stocks are falling during the rate-hike campaign (as was the case throughout last year).
In the meantime, the economy remains resilient and corporate earnings continue to grow. Therefore, over the next few months, you will get falling inflation with a dovish shift in Fed policy and rising earnings.
That’s a recipe for significant stock market strength. It is a fundamental recipe for a new bull market.
But the fundamentals aren’t the only indicators flashing bullish signals right now.
The technicals look just as – if not more – bullish.
Namely:
#1: The S&P 500 Held the Line
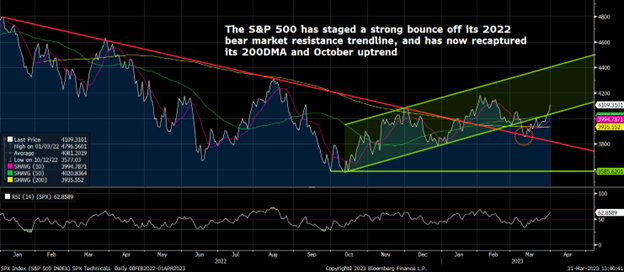
Throughout 2022, the S&P 500 formed a downtrend resistance trendline that it consistently failed to pop above. The stock market finally broke above that bear market resistance trendline in early 2023. It fell back to it during the February sell-off but has since bounced strongly off of it and retaken its 200-day moving average and October uptrend. In other words, the big resistance trendline of 2022 has become a support trendline in 2023. When resistance becomes support, you get breakouts. That’s exactly what we have with the entire stock market right now.
#2: An Ultra-Rare “Triple Barrel” Breadth Thrust Buy Signal Was Triggered in January
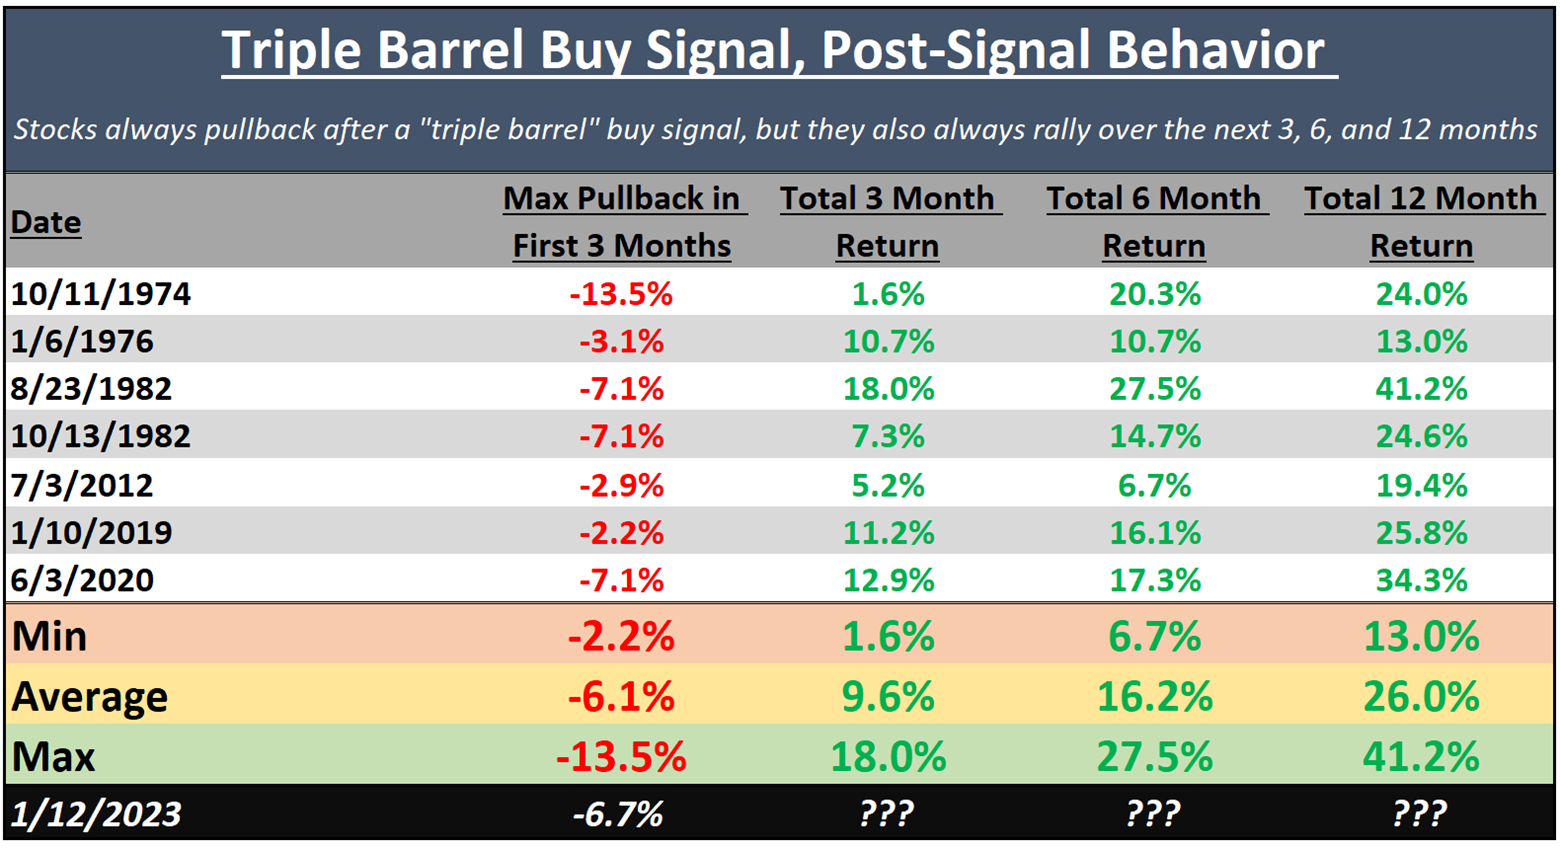
Back in early January, the market flashed an ultra-rare “Triple Barrel Buy Signal” wherein three powerful and rare breadth thrust signals – the Breakaway Momentum, Whaley Breadth Thrust, and Triple 70 Thrust – all flashed on the same day. The historical precedent for when at least two of those three indicators flashed on the same day is exceptionally bullish. It has only happened seven times before over the past 70 years, and each time, stocks were higher three months later, six months later, and 12 months later. This was the surest signal of them all that a new bull market was being born back in early January. To be sure, stocks did have a pretty big pullback in February, but that is totally normal. In fact, every single time a Double Barrel or Triple Barrel buy signal has been triggered over the past 70 years, stocks staged a pullback of at least 2% (and, on average, about 6%) within the next three months. Every time, they bounced back from that pullback, and rallied over the next 12 months. In other words, history says that what should happen after the Triple Barrel Buy Signal we got in January is a ~6% pullback in February, followed by a massive 12-month rally. We pulled back 7% in February – about average. Now, we are rebounding strongly to new highs. Coincidence? We think not.
#3: More and More Individual Stocks Are Flying to Fresh Highs
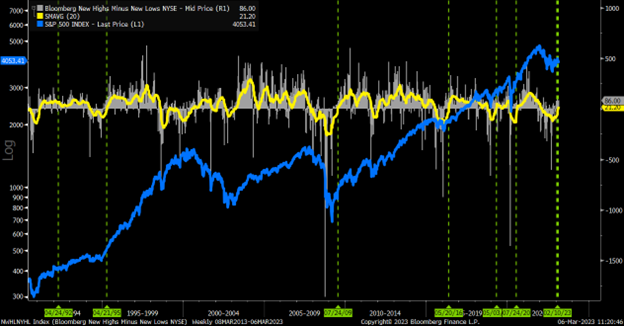
The number of net individual stocks making new highs – calculated by taking the number of stocks making new 52-week highs on any given day and subtracting out the number of stocks making new 52-week lows on that same day – has been consistently and strongly rising over the past few months. The 20-week moving average of that metric has now popped into positive territory for the first time in this cycle. Historically speaking, whenever the 20-week moving average of net new stock highs pops back into positive territory after spending a long time in negative territory – exactly what we have today – the stock market is in the midst of going from a bear market to a bull market.
#4: The Market Retakes Its 200-day MA
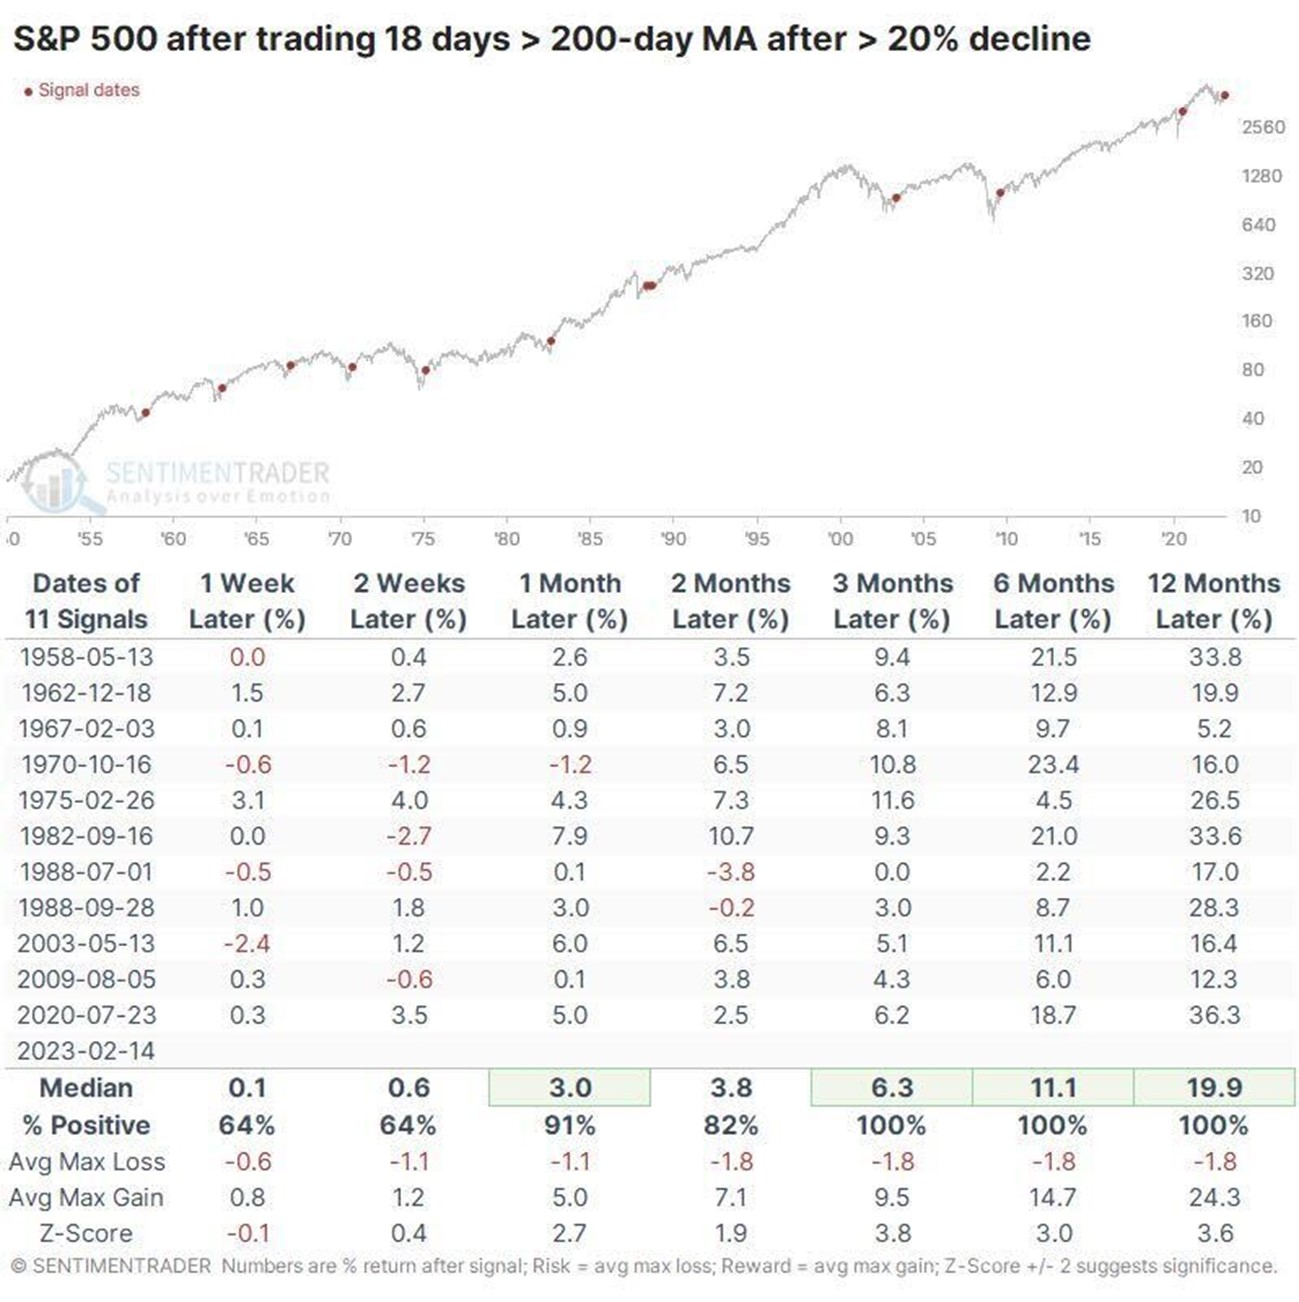
The S&P broke above its 200-day moving average back in January and then stayed above it for the next ~30 trading days. The stock market has never before broken above its 200-day moving average, stayed above it for more than 20 days, and then re-entered a bear market. Never. Every single time the market jumped back above its 200-day moving average and then stayed there for more than 20 days, stocks went on to enter a new bull market.
#5: The Stock Market Has Triggered an Infallible “Super Golden Cross” Signal
In traditional technical analysis, a golden cross is triggered when a short-term moving average on a stock (like the 50-day moving average) flips above a long-term moving average (like the 200-day moving average). It is usually bullish. We have, however, created a special type of golden cross called the “Super Golden Cross” signal which is always bullish. The Super Golden Cross is triggered when the 50-day moving average crosses above the 200-day moving average, stays above it for more than three days, and has spent at least the previous nine months trading below it. Between 1950 and 2022, this Super Golden Cross Signal was triggered eight times. All eight times, it marked the end of a bear market and the beginning of a new bull markets. The average 12-month forward returns in the S&P were 17%. This infallible Super Golden Cross signal was just triggered in the S&P last month.
The Final Word
We believe the evidence is nearly irrefutable. Fundamentally and technically, the stock market is sprinting into a new bull market.
But does the bull market have legs? Is this the start of a three-, five-, or maybe even 10-year uptrend in stocks?
We think so, largely because of the favorable technical factors listed above.
If it is, then you should be getting greedy right now. Whenever a bear market turns into bull market – which is exactly what is happening right now – stocks tend to soar by nearly 45% over the next 12 months!
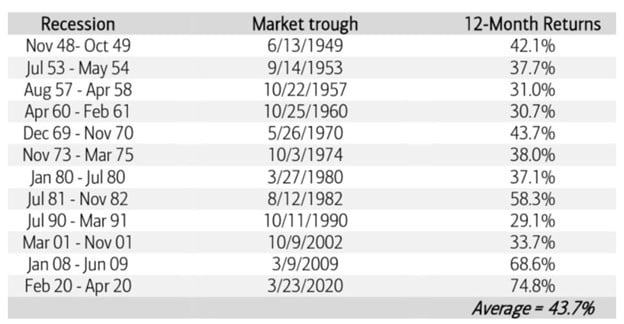
This is a huge money-making opportunity.
And, as the chart above illustrates, huge money-making opportunities like this only emerge about once every 10 years.
That’s why we developed the perfect tool to capitalize on this huge opportunity.
It is a quantitative stock-picking system that we’ve developed, tested, and perfected over the past 12 months.
Its purpose? To find the most explosive stocks in the market – before they explode higher.
We use this system to find stocks that can rally 50% in a week, or 100% in a month, or 500% in a year.
And we’ve already (in the midst of a bear market) used this system in real-time to score several winners, just like that.
This system is groundbreaking. It works. And it can work for you.
But, most importantly, it is the perfect tool at the perfect time.
And that’s why, this Wednesday, I’m going to reveal the details of this breakthrough stock trading platform that’s already scoring readers some huge and fast returns.
I earnestly believe this platform could be your most powerful tool to scoring consistent huge winners in this new breakout bull market.
Reserve your seat to my presentation now.
On the date of publication, Luke Lango did not have (either directly or indirectly) any positions in the securities mentioned in this article.
