One of the interesting aspects of this sell-off is that weakness hasn’t necessarily been concentrated where an investor might think. U.S. stocks already had valuation concerns heading into 2020. The economy was wrapping up its eleventh year of expansion. The spread of the coronavirus catalyzed fears on both fronts.
In that environment, it would stand to reason that cyclicals, high-flyers, and China plays all would struggle. That hasn’t necessarily been the case.
Chinese stocks, for instance, haven’t performed that badly. The iShares MSCI China ETF (NASDAQ:MCHI) is only down 1% so far in 2020, and has pulled back just 6.4% from mid-January highs.
Cyclical stocks should be vulnerable in an environment where recession risk is rising, but some sectors have held up while others have weakened. Travel stocks unsurprisingly have been hammered. Macro-sensitive casino stocks were crushed on Thursday.
But construction and home improvement stocks are hanging in. Homebuilders Lennar (NYSE:LEN) and D.R. Horton (NYSE:DHI) both sit less than 10% below their highs. Home Depot (NYSE:HD) remains not far from its highs, though rival Lowe’s Companies (NYSE:LOW) has weakened.
And one would think given the stunning gains — and valuations — of growth stocks in recent years that high-flyers would be plunging. But the likes of Amazon (NASDAQ:AMZN), Square (NYSE:SQ), Salesforce.com (NYSE:CRM), and Shopify (NYSE:SHOP) all are positive year-to-date.
Even though most stocks have declined, this hasn’t been an indiscriminate sell-off, even among growth stocks. But many of those names did suffer in trading Thursday as broad market indices fell more than 3%.
Friday’s big stock charts focus on three of the growth plays that saw particular weakness yesterday. And while other stocks in the group have avoided disaster, trouble looms for these names. Given that growth stocks led much of this bull market, that might be bad news for the market as a whole.
Uber (UBER)
It wouldn’t be terribly surprising if Uber Technologies (NYSE:UBER) traded at all-time lows at the moment. As the first of Friday’s big stock charts shows, that’s not the case yet — and it might not happen:
- There’s a lot going on in the UBER chart, but at the least the stock is consolidating. Support has come in, if inconsistently, above lows reached toward the end of 2019. Trading since late October established a broadening ascending wedge, a bullish formation. UBER even saw a “golden cross” on Wednesday as the 50-day moving average crossed above the 200DMA (and on decent volume). There are some reasons for optimism.
- There are reasons for concern, too. Recent trading creates a pennant formation, a continuation pattern that suggests there could be another leg down. UBER made a quick, bearish test of the 50DMA late last month. If support breaks, UBER is headed below $30, and a re-test of November (and all-time) lows below $26 could follow.
- Even with shares already down over 20% from February highs, such a move wouldn’t necessarily be shocking. It’s not hard to imagine that pandemic fears will keep consumers from paying to sit in a stranger’s personal vehicle. Lower airline passenger numbers could provide another modest headwind. Investor nervousness can’t help, either, for a stock with negative earnings and a somewhat steep valuation relative to gross profit dollars (if not necessarily revenue).
- And so UBER is in a precarious spot at the moment. Technically, support has to hold. Fundamentally, the stock isn’t cheap. And sentiment toward similar names seems to be negative and getting worse. The sell-off may not be over.
Splunk (SPLK)
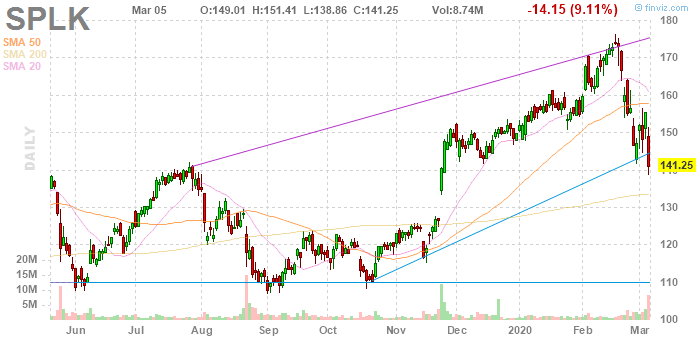
Big data play Splunk (NASDAQ:SPLK) has seen a reasonably sharp sell-off from mid-February highs. The second of our big stock charts suggests it could get worse:
- SPLK simply keeps breaching support levels and is doing so in a hurry. A test of the 20DMA failed after just one session. Shares bounced briefly off the 50-day before reversing. A brief rally then was interrupted by a 9% decline on Thursday, an apparent response to disappointing guidance given with Wednesday afternoon’s fiscal fourth quarter release. That fade establishes an inverted cup-and-handle pattern. If SPLK can’t hold the 200DMA around $133, there’s at least a chance of the stock re-testing 2019 support at $110.
- For market bears, such a move hardly would be surprising. Even looking to fiscal 2021 (ending January) guidance, SPLK stock still trades at nearly 8x sales. Non-GAAP operating profits this year are guided to roughly zero. Splunk is transitioning its model to the cloud — a shift to which its chief executive officer attributed the disappointing outlook — and growing quickly. Still, those investors who long have worried about software valuations will hardly see SPLK as a value play.
- As with UBER, the chart shows significant risk if support doesn’t hold near current levels. And for both stocks, that seems to require the market to get back to its 2019 ways, where growth trumped valuation. Without that shift, even investors looking to buy the dip may look elsewhere.
Carvana (CVNA)
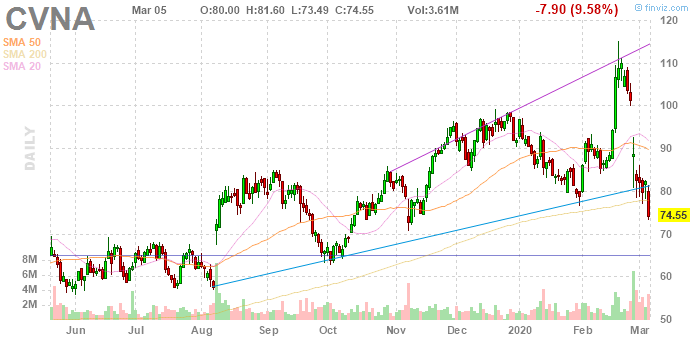
The third of Friday’s big stock charts, Carvana (NYSE:CVNA), looks much like the first two. The same concerns hold:
- CVNA stock has also quickly fallen through moving averages, with Thursday’s decline creating a failed test of the 200-day moving average. The next key level is $65, which provided resistance last summer before reverting to support in early October. Note that volume has been rather high in the last few sessions. That suggests at least some shareholders were looking for the door even after CVNA sold off following Q4 earnings last month.
- Even relative to other growth names, sentiment can get worse. Carvana remains sharply unprofitable. Its shares trade at over 3x 2019 revenue despite relatively thin gross profits. Automobile stocks are plunging at the moment, which suggests investors are projecting weak industry revenue going forward. There’s a real risk of decelerating revenue growth, yet that deceleration still doesn’t look priced in.
- As a result, CVNA is a useful example for investors who believe the broad market can get worse. Yes, U.S. stocks have pulled back. But valuations are still high relative to historical levels. Macro risk is elevated. And we simply haven’t seen the sustained capitulation that generally marks a market bottom. It certainly seems like Carvana stock could, and maybe should, have more downside. That alone suggests the same is true for the market as a whole.
Vince Martin has covered the financial industry for close to a decade for InvestorPlace.com and other outlets. He has no positions in any securities mentioned.


