Trading Thursday seems like a microcosm of this market. U.S. stocks set new all-time highs in the morning. After major indices stumbled midday amid rising fears, investors once again bought the dip. Those indices did close in the red, but maintain a chance to close the week strong.
This simply seems like a more volatile market, even if volatility as measured by the CBOE S&P 500 Volatility Index is well within the historical range. And it’s definitely been a split market, with tech continuing to rise while sectors like energy and retail struggle.
Friday’s big stock charts look at three names that highlight year-to-date trading. All three stocks have made big moves so far this year. They represent three of the sectors with the most consistent — if not necessarily positive — performance. Interestingly, they might all have a path to at least a bounce, and maybe significant upside.
Twilio (TWLO)
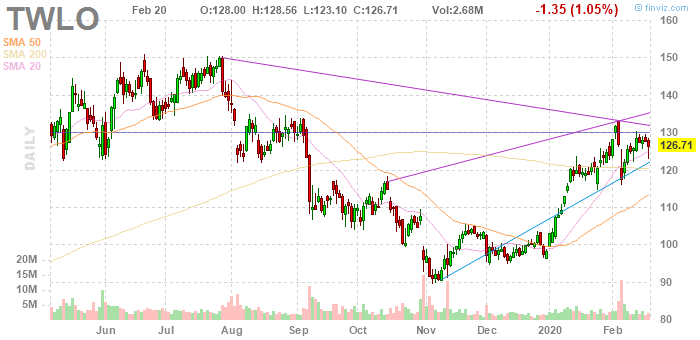
There’s a lot going on in the first of Friday’s big stock charts. But from a technical perspective, at least, there’s a case that the rally in Twilio (NYSE:TWLO) stock should continue:
- The bullish case is that TWLO’s 29% YTD rally can push the stock through resistance. The gains have created an ascending triangle pattern. A “golden cross” probably is on the way, with the 50-day moving average crossing the 200-day. TWLO probably needs more volume for that indicator to be taken seriously, but that aside there’s still a solid uptrend established going back to early November lows.
- The bearish case is that resistance has held around $131 repeatedly going back to last summer. Volatile trading since a mixed earnings report early this month doesn’t look all that bullish. While a golden cross looms, TWLO could see a bearish inverted head-and-shoulders pattern as well. Even the uptrend looks more like a narrowing ascending wedge, often a reversal pattern.
- Net/net, however, the chart looks bullish, particularly in the context of this market. Investors simply have found reasons to buy growth stocks in tech, despite valuation worries. At more than 15x trailing twelve-month revenue, Twilio has those worries. But the company has assuaged past fears about customer concentration and was one of the best stocks in the first half of 2019. It has a chance to be one of the best names in 2020 as well.
VF Corporation (VFC)
As the second of our big stock charts shows, investors have decided that apparel maker V.F. Corporation (NYSE:VFC) is a buy under $85. The only question is if fundamental worries will change that sentiment:
- Support has held repeatedly just below the current price of $84 going back to last spring. More recently, since plunging following a fiscal third quarter earnings miss last month, VFC has established a multiple bottom. The combination suggests a rally is likely at some point, particularly if the market as a whole takes another leg higher.
- The one technical concern, however, matches the fundamental worries. Recent trading looks like a flag/pennant formation — a continuation pattern. Meanwhile, V.F. Corp. has shown disappointing performance of late. Q2 earnings in October led to a sell-off. It’s not as if the business is in disarray: full-year earnings per share guidance came down just pennies after the third quarter. But the Timberland brand is struggling, and the company hasn’t quite delivered the numbers investors have expected. That combination raises risk ahead of the fourth quarter earnings report, likely due in May,
- For now, however, VFC looks intriguing. This still is a company guiding for 16-18% growth in EPS this year — while trading at a little over 25x updated guidance. That’s a combination not available with too many stocks in this market. As long as that holds, VFC stock likely does as well.
EQM Midstream Partners (EQM)
Lower natural gas prices have led shares of EQM Midstream Partners (NYSE:EQM) to plunge. But the third of Friday’s big stock charts shows a recent bounce that could continue:
- At the very least, we’ve been here before. EQM stock rallied almost 40% from similar levels in December. A dividend yield now over 20% might bring in investors. And while lower natural gas prices are a long-term risk, they shouldn’t directly impact near-term volumes. Unless production plunges or customers go bankrupt, EQM’s earnings should be able to at least hold up. With EQT Corporation (NYSE:EQT) the largest customer, customer bankruptcy risk looks manageable.
- One point worth noting: EQM isn’t alone. The charts of other natural gas pipeline operators like Antero Midstream (NYSE:AM) and EnLink Midstream (NYSE:ENLC) look rather similar. Those stocks actually have higher yields, at 24% and 22%, respectively. Those other charts, and yields, show that there is some sector-wide logic to the weakness in EQM.
- Still, there’s a case that at least some investors are mistaking natural gas price weakness for future volume weakness. And there’s a case that value buyers might again step in. Price and yield alone don’t make a bull case, particularly in this market. Still, EQM and its peers look awfully cheap.
Vince Martin has covered the financial industry for close to a decade for InvestorPlace.com and other outlets. He has no positions in any securities mentioned.


