Once again, U.S. stocks sit at all-time highs after solid gains on Thursday. Market bulls continue to roar. 2019 is going out the way it came in, with an impressive rally.
The S&P 500 now has gained nearly 28% so far this year — and the gains have been broad and deep. Just 14% of that index’s components have declined so far this year, with many of those stocks in the energy and retail sectors.
Friday’s big stock charts focus on three of those decliners. All three stocks have shown signs of life lately, and their shareholders are hoping for a better 2020. But in all three cases, the charts suggest reason for caution as well.
3M (MMM)
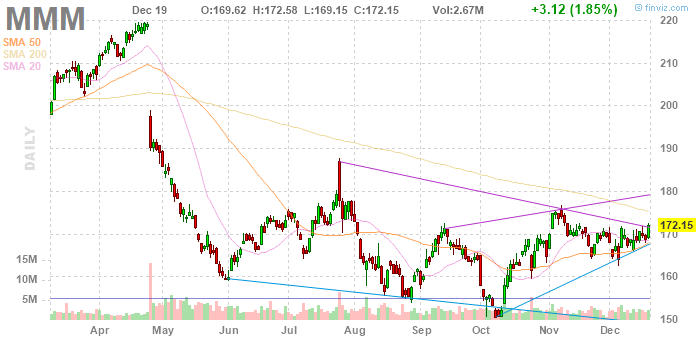
The first of Friday’s big stock charts suggests a move is imminent. The question for 3M (NYSE:MMM) is in which direction the stock will head:
- MMM stock has established a textbook triangle pattern after trading in a tight range over the past month. Usually, once that pattern is exited, the trend accelerates in that direction. At the moment, that seems like good news for MMM stock, which rallied nearly 2% on Thursday. Near-term moving averages look like they’re providing support in recent sessions. There’s a reasonably solid uptrend from October lows. The 200-day moving average could provide resistance if MMM stock moves higher, but there’s a technical case that a breakout looms.
- Fundamentally, the news is a bit more mixed. I was skeptical toward MMM stock in early August, not far below current levels. Execution has been lacking in recent years. The chances of a cyclical downturn suggest valuation should be reasonably moderate. On the other hand, a 3.35% dividend yield and an 18x forward P/E multiple both seem reasonable, even in that context. And progress on the trade war could drive improved results in China, which has been a difficult market for the company of late. It’s likely trade optimism has contributed to the rally in recent sessions, and that sentiment could provide a tailwind to the stock in 2020.
- All told, a true breakout may be too much to ask for in the near term. But there’s some reason for optimism that 3M stock can keep grinding higher. And if shares can breach the 200DMA, it’s possible that breakout may arrive after all.
Arista Networks (ANET)
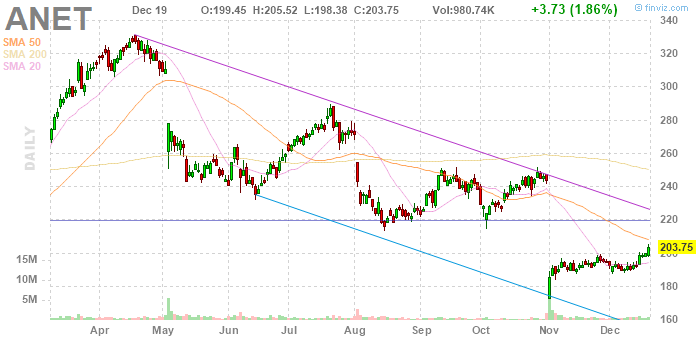
Thursday’s big stock charts focused on networking stocks, which mostly have struggled this year. Arista Networks (NYSE:ANET) has been no exception, falling over 35% from its highs after three consecutive post-earnings sell-offs. Shares have managed to rally in recent sessions, but there’s a case that the rally could be short-lived:
- The second of Friday’s big stock charts shows that ANET stock has established a relatively textbook flag pattern at the moment. Flags are continuation patterns, and the months-long trend here obviously is bearish. The 50-day moving average portends near-term resistance, with $220 the next key level. The reversal isn’t guaranteed, and may not arrive immediately. But aggressive traders may want to mark their calendars for mid-February, when Arista reports fourth quarter earnings.
- Fundamentally, there’s some reason for concern. ANET stock is cheaper, but at 22x forward earnings it isn’t necessarily cheap, particularly by the standards of the sector. The reactions to recent earnings reports don’t seem overblown, as key customers have pulled back on spending. Microsoft (NASDAQ:MSFT) was the culprit in the second quarter, while Facebook (NASDAQ:FB) appears responsible for soft guidance given with the Q3 release.
- There is potentially a contrarian case for shares. Chris Tyler made the case for ANET in early November, and that case has played out so far. Arista still should be able to drive growth going forward, and investors may see Arista stock as one of the last reasonably-valued cloud plays out there. Still, between the chart and recent history, it seems risky to own Arista stock ahead of what looks like an important release in February.
Gap Inc. (GPS)
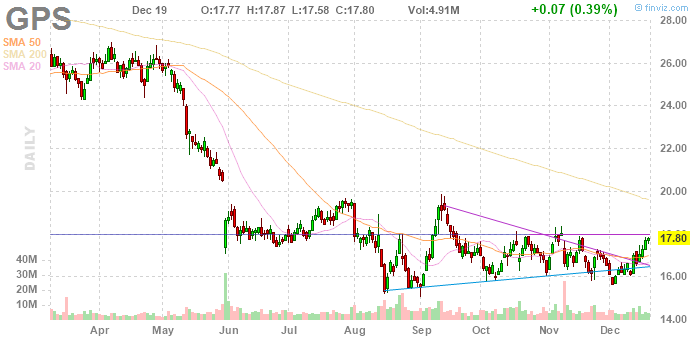
Like many mall-exposed retailers, Gap (NYSE:GPS) has had a difficult 2019, with shares down 31%. But the issue for Gap actually is concentrated in its business outside of traditional malls. Both the third of Friday’s big stock charts and qualitative concerns suggest a rally may take some time:
- Technically, there is a bit of optimism here. GPS stock exited a narrowing wedge to the upside earlier this months. Support seems to have held around $16. But resistance quite obviously has been firm at $18, and given that level has reverted from previous support, it will take some momentum to bust through.
- The problem is it’s difficult to see what drives that momentum. Despite its name, Gap is an Old Navy story at this point; the concept almost certainly drives over two-thirds of consolidated profit. Gap plans to spin that business off, but those plans are in doubt after chief executive officer Art Peck stepped down last month. Meanwhile, Old Navy’s results have been disappointing so far this year, and management commentary suggests improvement isn’t likely until 2020.
- From a long-term standpoint, GPS still looks intriguing, one reason why I own shares in the company. But barring a sector rally or news on the spin-off front, this likely is a 2020 story at best.
As of this writing, Vince Martin is long shares of Gap Inc. He has no positions in any other securities mentioned.


