Stocks were back and forth, in the red and in the black, for the better part of Thursday’s action. When push came to shove as the closing bell approached though, neither side of the table was doing much shoving. The S&P 500 closed a mere 0.05% lower yesterday.
It wasn’t because some names didn’t do their part. Boeing (NYSE:BA) rallied more than 4% after announcing it had won a respectable contract from the Department of Defense to upgrade wings on the more than a hundred A-10 attack aircraft. But, investors may have been further encouraged by word that the aircraft maker was planning on ramping up output of the beleaguered 737 MAX. That news suggests customers believe the passenger jet can be made safe.
There were just too many names like Splunk (NASDAQ:SPLK) holding the market down. Shares of the software company fell nearly 8% despite a solid quarterly report, as Splunk also announced an acquisition investors aren’t entirely convinced is a great idea for the $1 billion it’s paying for the deal.
Neither are great prospects headed into Friday’s trading, however. Rather, stock charts of Nvidia (NASDAQ:NVDA), Albemarle (NYSE:ALB) and HP (NYSE:HPQ) have earned closer looks. Here are those looks.
HP (HPQ)
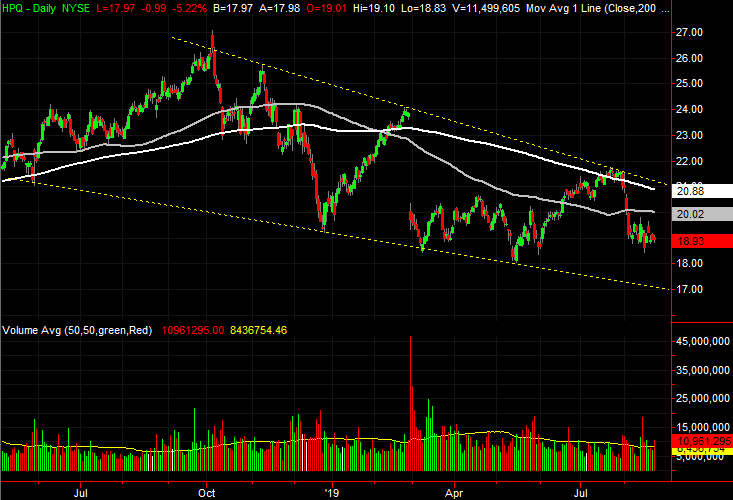
HP shares have been all over the map since late last year, and weren’t exactly a picture of stability for the better part of the past three years. The selloff since October, however, has not only been bearish, but well framed by clear support and resistance levels.
The bad news is, that trading range is steering HPQ stock lower, and there’s more downside to go before the floor is bumped into again. Perhaps worse, the bearish momentum is starting to build in a way that portends lower lows are imminent.
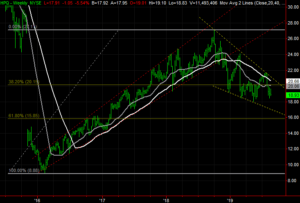
Click to EnlargeAlthough choppy, HP has framed a bearish channel, marked with yellow dashed lines on both stock charts. HPQ stock is moving towards that floor, but remains nearly two points above it right now.- It’s not yet consistent, but the volume behind several of the most recent selloffs has been above average.
- With no other framework in sight that could serve as a landing spot now; the next most likely technical floor is the Fibonacci retracement line at $15.85.
Nvidia (NVDA)
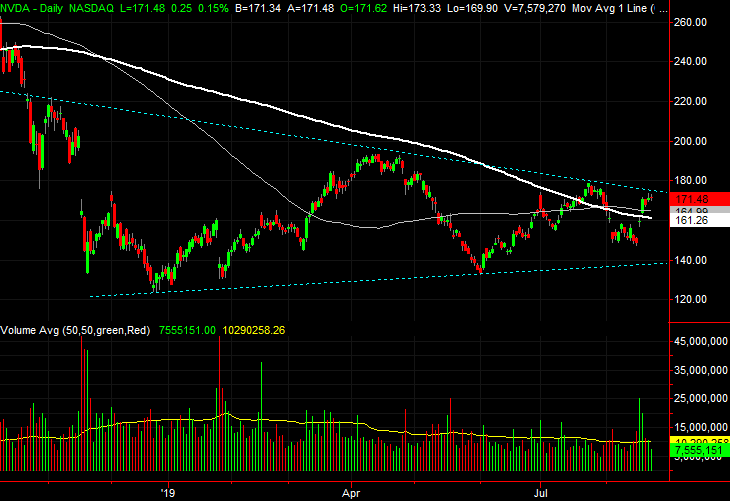
Nvidia was one of the hardest-hit names last year, sent lower in step with the broad market’s weakness, which was exacerbated by a meltdown of the crypto-mining industry.
NVDA stock has been working on a recovery since late last year though. It has not been able to form one just yet, but it continues to try. The end result is a well-made set of support and resistance lines. Better still, Nvidia stock is close to punching through the upper boundary.
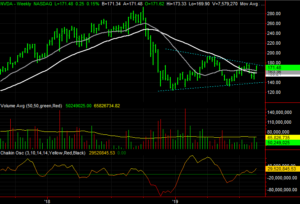
Click to EnlargeThe support and resistance lines in question are marked as blue line on both stock charts. The upper boundary is being tested again this week.- Although not yet above straight-line support, this week NVDA stock has pushed its way back above the gray 100-day moving average line and the white 200-day line.
- It has not yet firmed up, but there’s above-average bullish volume materializing here and it has been enough to let the weekly chart’s Chaikin line move back above the zero level.
Albemarle (ALB)
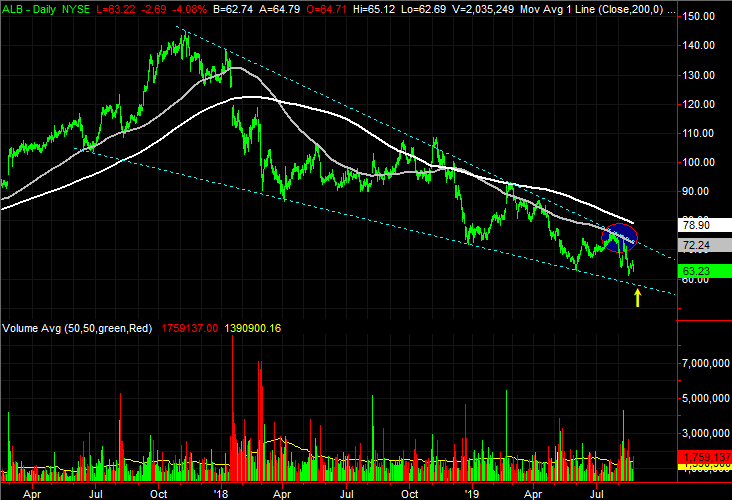
Finally, Albemarle has been in something of a nosedive since early last year. Although it has seen the occasional rebound effort, each one of them has been met by a move to lower lows.
There has been a method to the madness, however. Each lower low and each lower high has contributed to the establishment of a well-defined, falling trading range. The current trajectory is clearly downward, but that doesn’t necessarily mean ALB has to stay on the path. It does, however, suggest there’s room for a little more downside before traders have to make a decision.
Click to EnlargeIt’s plotted on both stock charts, with dashed blue lines. Either way, it’s clear Albemarle shares are being squeezed into the tip of a narrowing wedge pattern that will force a decision.- Although the descending wedge is currently bearish, and the gray 100-day moving average line is now resistance, the whole move could fuel an explosive move higher if the upper boundary can be snapped.
- And although the converging support and resistance could be building up a major breakout move, for the time being, ALB stock looks like it’s aiming to test the lower boundary around $60, marked with a yellow arrow.
As of this writing, James Brumley did not hold a position in any of the aforementioned securities. You can learn more about him at his website jamesbrumley.com, or follow him on Twitter, at @jbrumley.
