Every trading session tells a different story. The story being told on Wednesday was that the market is quite relieved to see oil starting to bounce back.
Traders were also optimistic that the U.S. government would provide much-needed relief for small businesses. These considerations seemed to be more important than corporate earnings reports, which were a mixed bag on Wednesday.
Let us not ignore those earnings releases, however. Some sizable moves were seen as a result of the earnings data. Therefore, today’s big stock charts will feature names that made a noticeable move based on their earnings reports.
Snap (SNAP)
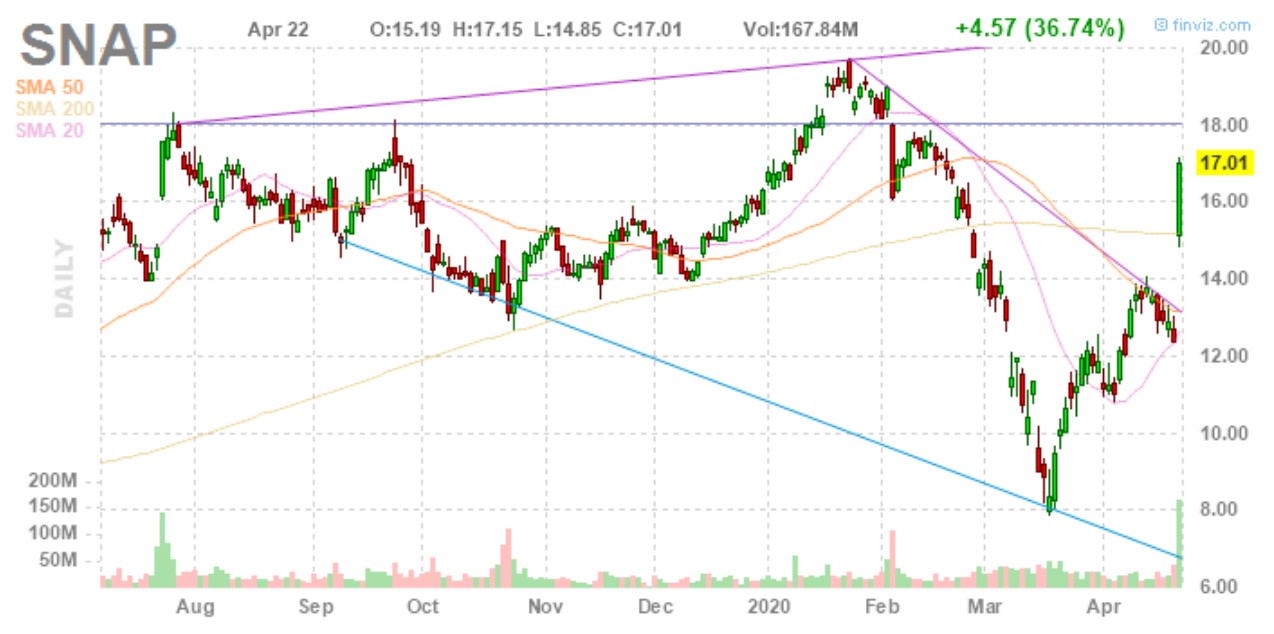
For the company’s first fiscal quarter, Snap (NYSE:SNAP) reported an astonishing 44% year-over-year increase in revenues. This increase was driven by Snap’s 20% growth in daily active users compared to the same quarter of the previous year. The big stock chart will reveal how the market reacted to this news.
- The candlestick for Wednesday shows not only a big morning gap up, but also a large green body. The momentum is very strong as the price started high and just kept going up throughout the trading session.
- There’s also a large green volume bar accompanying Wednesday’s price movement. The falling wedge chart pattern is now completely invalidated, and the bulls will be happy about that.
- Still, we must always be cautious traders. There’s a support/resistance line at the $18 level. The SNAP stock price is now approaching that level, so it might be a good place to consider taking profits.
Biogen (BIIB)
Turning our attention to Biogen (NASDAQ:BIIB) stock now, we should note that both the earnings and revenues were better than expected for the first quarter.
However, that evidently wasn’t enough to appease the trading community. Biogen unfortunately revealed that the company expects to finalize the filings for its Alzheimer’s drug in 2020’s third quarter, which is later than what was previously expected.
- The gap down in the price of BIIB stock on Wednesday morning obviously put the bears in charge. However, the lower wick on the candlestick shows that at least the price didn’t close too close to the low of the day.
- We now have a double-top formation on the chart. The resistance level is $340, so the bulls will need to reclaim that level in order to regain control of the price action.
- There is strong support at $270, however. Therefore, the bears should prepare for a possible bounce if BIIB stock gets to that level in the next couple of weeks.
L Brands (LB)
We’ll round out Thursday’s big stock charts with L Brands (NYSE:LB). This stock plunged after the company released its earnings data, to the point that trading on the stock was temporarily halted.
Reportedly, the private equity firm Sycamore intends to terminate its deal with L Brands to buy Victoria’s Secret. How does that disappointing development impact the price chart for LB stock?
- This one wasn’t a case of a huge gap down, but rather of the price trending downward during the trading session. Still, the lower wick on Wednesday’s candlestick indicates that the buyers did assert themselves at some point.
- Interestingly, that lower wick touched the $9 support level. Several other lower candlestick wicks reached that same level before the share price came back up.
- LB stock has been all the way up to $24 and higher on the chart, but bulls shouldn’t get greedy. If a bounce pushes the share price up to the $16 support/resistance level, it’s perfectly fine to take profits there. As I’ve said before, don’t be a greedy pig because pigs get turned into bacon!
As of this writing, David Moadel did not hold a position in any of the aforementioned securities.


