By one measure, the bull market returned on Thursday. As we noted in yesterday’s Big Stock Charts, there was a technical argument that the Dow Jones Industrial Average had done so yesterday. The case is easier to make after the Dow rallied another 6.4% on Thursday.
As Barron’s noted, the term “bull market” isn’t set in stone. But the Dow, incredibly, has rallied 21.3% in just three sessions, satisfying one common definition. Add in a late-day rally Monday and the bounce nears 24%.
A snapback rally in Boeing (NYSE:BA) has been a key contributor. But the S&P 500 itself has gained 18% in three days. The rally has been broad as well as steep.
As U.S. stocks look to close what could be the best week of trading since the 1930s, optimism seems to have returned. Friday’s big stock charts look to tap into that optimism. Like the market, all three stocks found support. And all three could see more upside ahead.
JD.com (JD)
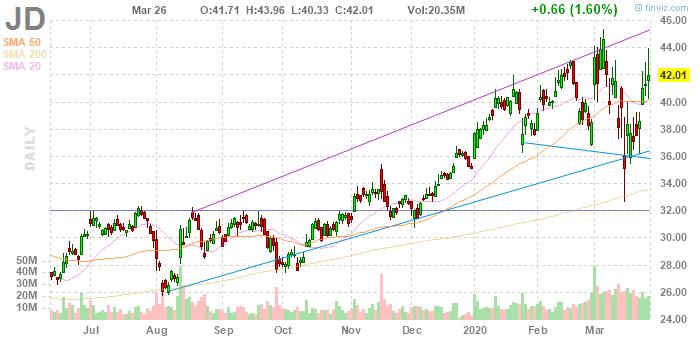
To look at the first of Friday’s big stock charts, one might not even know a sell-off had occurred. JD.com (NASDAQ:JD) has mostly rallied through broad market declines, and there’s a case that the rally should continue:
- For the most part, this simply looks like a solid chart. A broadening ascending wedge that’s held since August suggests new highs are on the way. Excluding a short-lived dip, JD stock mostly has held the 50-day moving average, which can provide support going forward as well. An investor might worry about short-term resistance as a few rallies have reversed this year, but that aside it seems like JD stock should head higher.
- Fundamentally, there’s a strong case. Just last week I highlighted JD stock as one of seven stocks that had survived the market carnage and could keep rallying. Shares aren’t all that expensive relative to trailing earnings. China is getting back to normal. Its e-commerce market is big enough for both JD and larger rival Alibaba (NYSE:BABA).
- That said, JD probably needs this rally to hold, or at least not reverse. Trading earlier this month shows that broad market weakness can bring JD.com down with it. In-country risk remains elevated. As with the market as a whole, investors can be hopeful but they still need to mind the downside.
Charter Communications (CHTR)
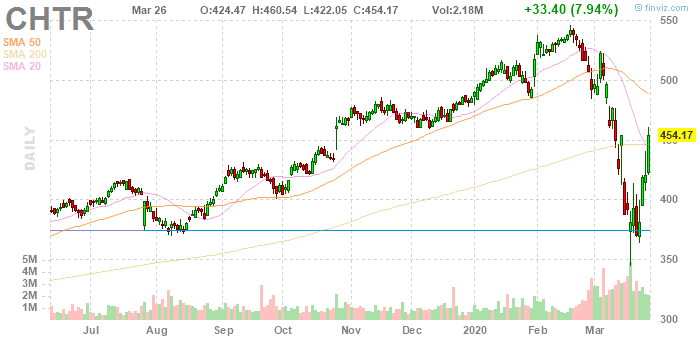
When we highlighted Charter Communications (NASDAQ:CHTR) in Big Stock Charts almost two months ago, the chart looked fantastic while the fundamentals were questionable. Even with CHTR stock 15% cheaper, this edition of Big Stock Charts sounds much the same:
- CHTR stock managed to bounce nicely off support that held in August. Thursday’s rally retook the 200-day moving average. There seems to be a path to at least the 50DMA, which suggests roughly 8% further upside.
- But the fundamentals still look questionable at this price. Charter still has to deal with the effects of cord-cutting going forward. A valuation of 23x forward earnings hardly seems cheap in that context.
- Charter has been a wonderfully-managed company as it’s built out its business through acquisitions. As a result, it was one of the best stocks of the bull market: at February highs, CHTR had rallied almost 1,500% from financial crisis-era lows. After this bounce Charter stock is basically back where it was in mid-December — and ‘only’ up about 1,200% from the 2009 nadir.
- For investors who believe the bounce of the last three days has gone too far, this chart can serve as Exhibit A. As steep as the decline seemed to be, there are a significant number of large-cap stocks like CHTR who now trade back where they did just months ago. Fundamentally, CHTR shows that the buying opportunity in the market as a whole might not be quite what a 30%-plus decline in major indices would suggest.
Thermo Fisher Scientific (TMO)
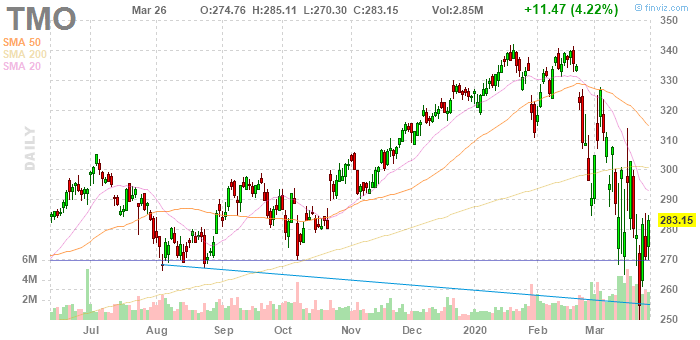
Market bulls might see it differently, however. Those that do should take a look at the third of Friday’s big stock charts, which suggests that Thermo Fisher Scientific (NYSE:TMO) has a rally ahead:
- As with CHTR, TMO stock has seen support hold, save for a brief decline during the worst of the market panic. But it hasn’t received quite the same bounce: shares are up ‘just’ 13% from their low (and even less looking to closing prices). There’s whitespace toward moving averages which can be reached if market stability holds.
- Meanwhile, Thermo Fisher shouldn’t have much, if any, real impact from pandemic fears. The life sciences supplier serves customers that have little or no macroeconomic exposure. The scramble to treat the coronavirus may cause some short-term supply chain issues, but hardly enough to drive a 17% decline from February highs.
- Again, market bulls should consider TMO here just above support. But skeptics might respond that the decline here makes more sense than it seems. Many believe that market valuations simply had run too far in February. From that perspective, the fall in TMO stock isn’t an unjustified sell-off. It’s a correction. And the same trend explains at least a portion of the big fall elsewhere in U.S. stocks.
Vince Martin has covered the financial industry for close to a decade for InvestorPlace.com and other outlets. He has no positions in any securities mentioned.


