It certainly seems like U.S. stocks are in a holding pattern at the moment. Another day of quiet trading means major market indices are basically flat over the past three sessions.
The lack of movement makes some sense. A hugely important batch of earnings reports loom next week, with four of the five most valuable U.S.-listed companies — Microsoft (NASDAQ:MSFT), Apple (NASDAQ:AAPL), Amazon (NASDAQ:AMZN) and Facebook (NASDAQ:FB) — releasing earnings. The impeachment trial is dominating the headlines. And there are some signs of weakness in broader macroeconomic performance.
Of course, those factors also suggest that some sort of movement is coming, particularly given that the last two earnings season peaks led a July sell-off and catalyzed an October rally. Friday’s big stock charts feature three names that on their own seem set to make a move, each of which could be amplified by broader sentiment.
General Motors (GM)
On a forward price-to-earnings basis, General Motors (NYSE:GM) is the fourth-cheapest stock in the S&P 500. But low valuation alone has done little for GM stock, which has remained stuck for years.
That may not change for some time — if ever. But the first of Friday’s big stock charts does at least suggest some near-term optimism ahead of earnings early next month:
- GM stock sits near the support line of a narrowing descending wedge, which often is a reversal pattern. The wedge does have a sideways lean, and likely still is too wide, but it’s worth noting that support for the last few years generally has held not far below current levels. A “hammer chart” pattern on Thursday helps the bull case as well. The chart isn’t perfect, but there is some evidence to suggest another reversal from levels under $35.
- Fundamentally, again, the valuation seems ridiculously attractive. GM stock trades at 5.5x forward earnings. Its dividend yields 4.4%. There are worries, among them “peak auto” and the rise of self-driving cars and electric vehicles from the likes of Tesla (NASDAQ:TSLA). But even those worries would seem to be priced in to at least some extent.
- But the core problem here is that the same bull case has held for years now and GM stock has gone nowhere. It generally has outperformed rival Ford (NYSE:F), but that’s a low bar to clear. General Motors still has a lot of work to do to change sentiment to the point where it can have a bull case that goes beyond “its stock is too cheap.” But it’s possible, if not likely, that the stock might be at least a little too cheap from a near-term perspective.
Charles Schwab (SCHW)
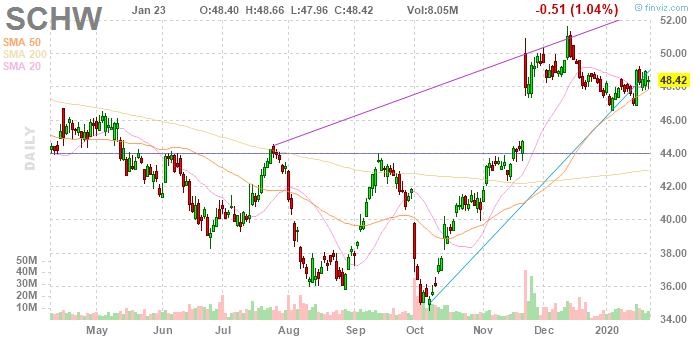
Charles Schwab (NYSE:SCHW) isn’t as cheap as GM. Its long-term performance hasn’t been quite as stagnant, but there are some similarities between the stories. The second of Friday’s stock charts also suggests potential near-term bullishness:
- SCHW has established a flag pattern. A big jump in November after the company announced its plan to acquire online brokerage rival TD Ameritrade (NASDAQ:AMTD) creates the ‘flagpole,’ while sideways trading since represents the ‘flag.’ Flag patterns usually are continuation patterns, which suggest another leg up. And while an ascending narrowing wedge does raise the risk of a reversal, the 50-day moving average has provided support, while a golden cross from early December hasn’t yet led to a rally. Here, too, the chart isn’t perfect, but it does lean positive.
- Schwab stock isn’t as cheap as GM, but at 19x 2020 earnings per share estimates is hardly expensive. Multiples pro forma for the TD Ameritrade deal are even lower. But there are fundamental worries facing a well-known U.S. consumer brand. Commissions in the industry are going to zero. Lower interest rates have pressured income from cash held in customer accounts. And SCHW stock has struggled over a broader period: shares actually are down 12% over the past two years.
- As with GM, while the near-term chart looks positive, secular risks explain a seemingly attractive valuation. For both stocks, market sentiment would help. That could either be a continued rally — or, perhaps, a long-awaited shift in investor demand from growth names to value plays.
LyondellBasell (LYB)
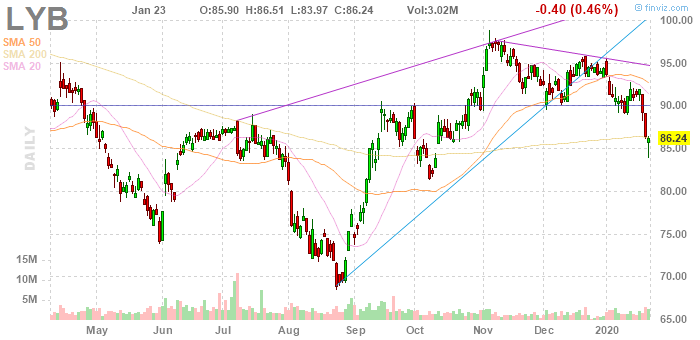
LyondellBasell (NYSE:LYB) is another value play that has struggled to drive shareholder value. But the third of our big stock charts looks much more concerning:
- LYB stock simply looks like it’s rolling over. $90 clearly has been established as a key level, providing resistance last year and support more recently. Shares now have breached that support while also reversing out of both an ascending narrowing wedge and a descending triangle. The one piece of good news is a hammer chart pattern on Thursday, in which shares held just below the 200-day moving average. But LYB seems to be hanging on by a thread at the moment.
- The trading looks particularly worrisome given that LyondellBasell reports fourth quarter earnings next week. The lack of confidence implied by recent trading doesn’t necessarily bode well. It’s possible a lower price will mean lower expectations. But it’s just as likely that the breakdown in LYB suggests that some investors are predicting a weak report — and others won’t be swayed by even a better-than-expected quarter.
- Bulls would respond that LyondellBasell stock is cheap. At less than 9x 2019 earnings per share, it is. An attractive dividend yield makes the stock an income favorite; as with other widely-held names, it’s possible that yield could provide support around $84 (at which point the yield would clear 5%). But LYB stock has been cheap for years, and other chemical giants like Dow (NYSE:DOW) and DuPont (NYSE:DD) look inexpensive on paper as well. “Too cheap” hasn’t been enough for LYB stock for most of the past decade, and it doesn’t look like it’s enough yet, either.
As of this writing, Vince Martin has no positions in any securities mentioned.


