In the investment world, there’s a lot of debate surrounding technical analysis. Some fundamentalists call technical analysis “hocus pocus” and think there’s nothing to it. Other traders, however, attest to the “price is truth” mantra, and believe that technicals give you the most insight about how and when to buy a stock.
I’m not here to settle this decades-old debate.
Rather, I’m here to do two things. First, I’ll give my personal two cents on the matter. Technicals don’t drive stocks. Fundamentals do. But, there’s enough information embedded into price action — and enough money out there paying close attention to technicals — that technical indicators can give investors very strong and accurate buy/sell signals.
Second, I’d like to highlight recent academic research from Professor Shu Feng of Boston University and Professor Na Wang and Professor Edward Zychowicz of Hofstra University. Analyzing data from 1993 to 2010, they found that technical indicators tend to perform better when sentiment is high, versus when sentiment is low.
Right now, market sentiment is high. The S&P 500 has rallied an impressive 4% over the past month alone to all time highs, and every investor sentiment reading has moved higher over the past few weeks.
Considering that technicals do matter, that technical analysis works better during periods of high investor sentiment and that investor sentiment is presently high, the implication is clear. It’s time to start buying stocks with strong charts and favorable technical indicators.
Stocks to Buy with Great Charts: Skechers (SKX)
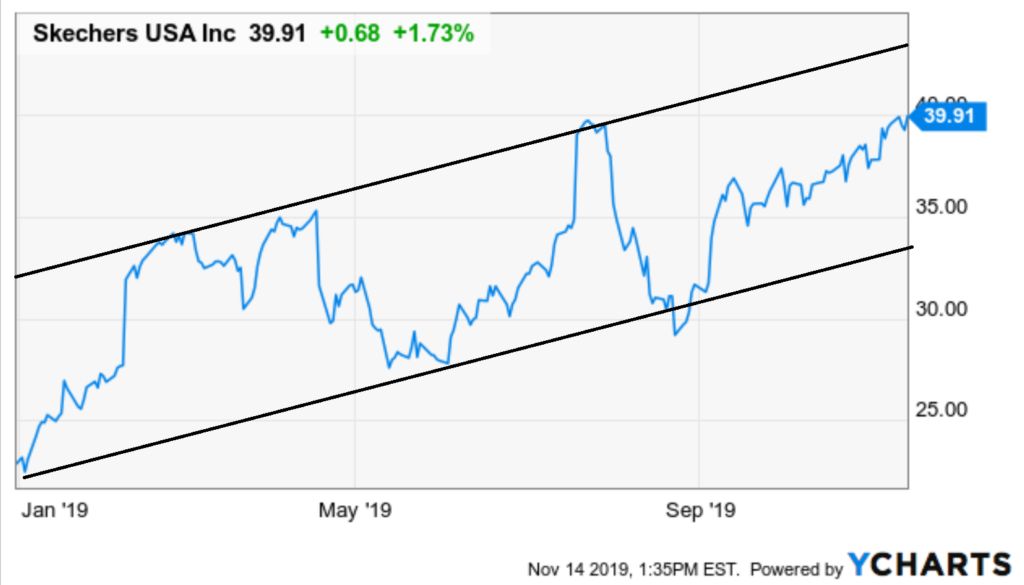
First up, we have athletic apparel maker Skechers (NYSE:SKX).
The 2019 chart for SKX stock is pretty clean and impressive. All year long, the stock has been on a steady uptrend, with well-defined support and resistance lines. Both of those lines have held multiple times, so barring some drastic change, they should keep holding for the foreseeable future. Assuming they do, the most likely path forward for SKX stock is to keep rallying until it hits its resistance line at around $45.
The fundamentals support further upside in SKX stock, too. Consumer attitudes are improving, and consumer spend this holiday season will likely be very strong amid easing trade tensions, re-accelerating economic activity, and still healthy labor market conditions. At the same time, athletic apparel tailwinds remain alive and well, and the Skechers growth narrative (over 15% revenue growth last quarter) remains equally vigorous.
Still, SKX stock trades at a huge discount to its sector and peers, and therefore, has plenty of room to keep moving higher, propelled by a healthy combination of profit growth and multiple expansion.
Trade Desk (TTD)
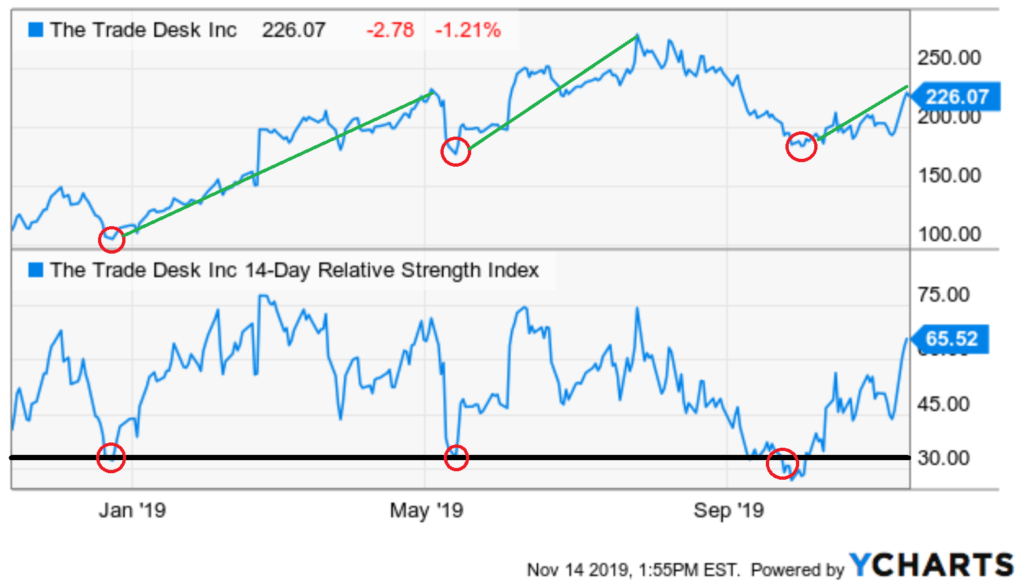
Second, we have programmatic advertising leader Trade Desk (NASDAQ:TTD).
The chart on Trade Desk implies that this stock is in the early stages of a big rebound. Specifically, TTD stock plunged into technically oversold territory (Relative Strength Index below 30) in late September. It has only done this twice before over the past year. Both times, the stock proceeded to bottom, reverse course and head substantially higher over the subsequent few months. It looks like the same thing is happening this time around, as TTD has bottomed and reversed course in October/November. If history holds up, shares should continue to trend higher.
The fundamentals underlying TTD stock are equally bullish. This company is pioneering the future of advertising, which is the usage of data, algorithms and machines to automate and optimize the ad transaction processes. This market, dubbed the programmatic advertising market, projects to grow by leaps and bounds as automation becomes more and more globally prevalent. Trade Desk will similarly grow by leaps and bounds in the long run. Near-term weakness is nothing more than noise for this long-term winner.
Plus, it looks like that near-term weakness is now fading out, which could mean that the coast is clear to buy the dip in TTD stock.
AT&T (T)
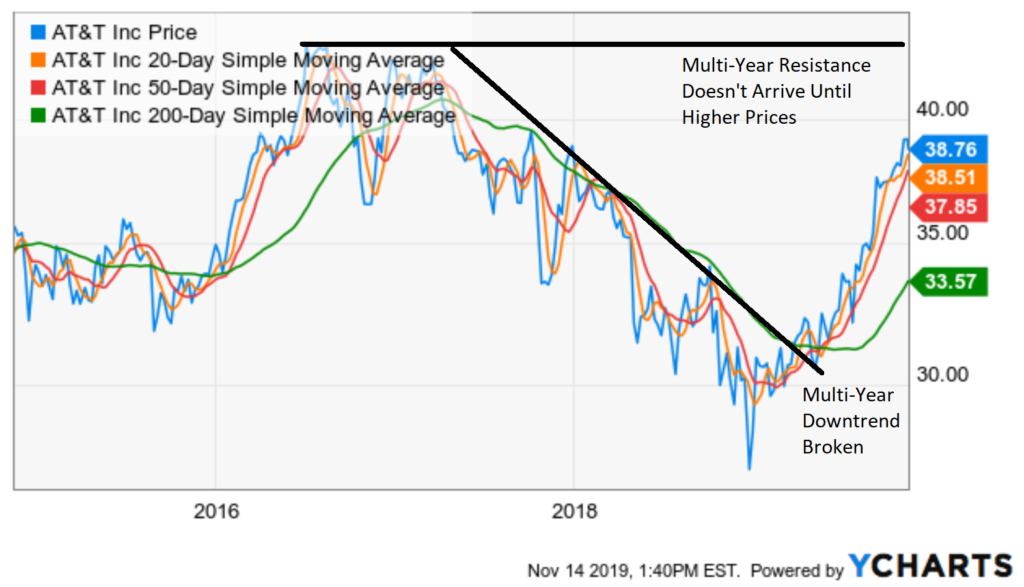
Third, we have telecom giant AT&T (NYSE:T).
The chart on T stock implies that shares are in the midst of a breakout which will persist until about $45. Specifically, T stock broke a multiyear downtrend in early 2019. Ever since, the 20-day moving average has surged above the 50-day moving average, and both have surged above the 200-day moving average — a favorable dynamic which implies building momentum in the stock. At the same time, multiyear resistance doesn’t arrive until around $45, so barring any drastic changes. Thus, T stock looks like it’s charting a course for that level.
AT&T’s fundamentals have similarly “broken out” in 2019. That is, this is a company which has been plagued by cord-cutting headwinds over the past several years. But AT&T is finally responding to those headwinds by building out a direct-to-consumer streaming service, HBO Max, which is set to launch in 2020. The expectation is that success in the streaming vertical will help offset weakness in the linear video vertical. Meanwhile, 5G coverage is going mainstream in 2020, and that should provide a boost to AT&T’s wireless business.
Overall, there’s a lot to like about T stock here, and improving fundamental and technical trends imply that the 2019 breakout rally in shares isn’t over just yet.
Under Armour (UAA)
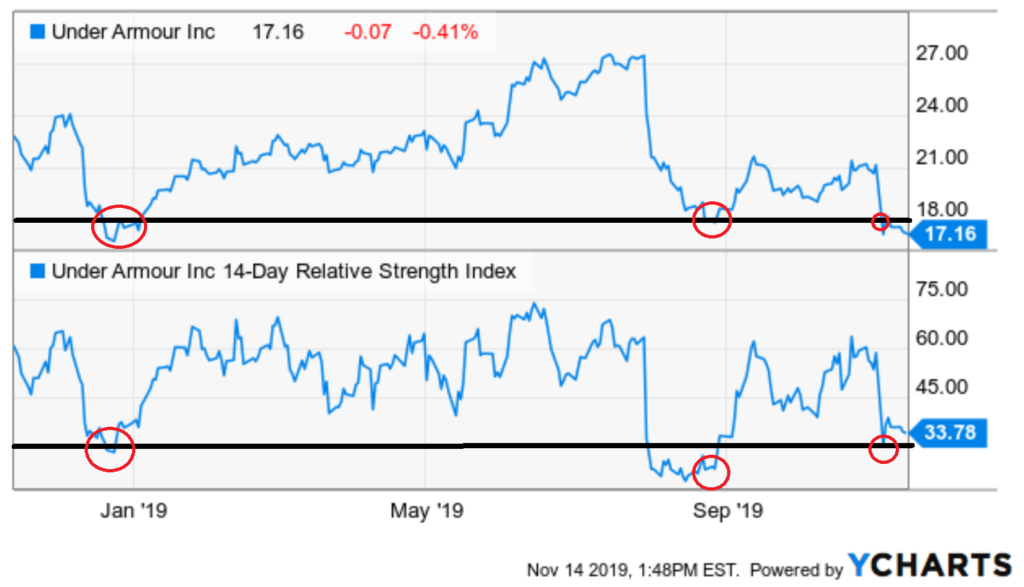
Fourth, we have another athletic apparel maker, Under Armour (NYSE:UAA).
The chart for UAA stock shows a stock which has been oversold and is due for a bounce-back soon. The technical buy signal on Under Armour over the past year has been buy when UAA stock drops below $18 and when the Relative Strength Index drops below 30. Right now, UAA stock is very close to flashing that buy signal, with shares below $18 and the RSI only a hair above 30. Once RSI drops below 30, history suggests UAA stock will bounce back in a big way.
Fundamentally, the recent sell-off in UAA stock also seems overdone. Sure, this is a slow-growth company with some brand identity, executive and accounting issues. But, they are still a very important brand in a very important and rapidly growing athletic apparel market, with margins that are making significant upward progress.
Considering all that, the long-term earnings power here says that UAA stock is worth a lot more than $17.
The implication? Be ready to buy this dip. UAA stock won’t stay down here for long.
Okta (OKTA)
Fifth, we have cloud security company Okta (NASDAQ:OKTA).
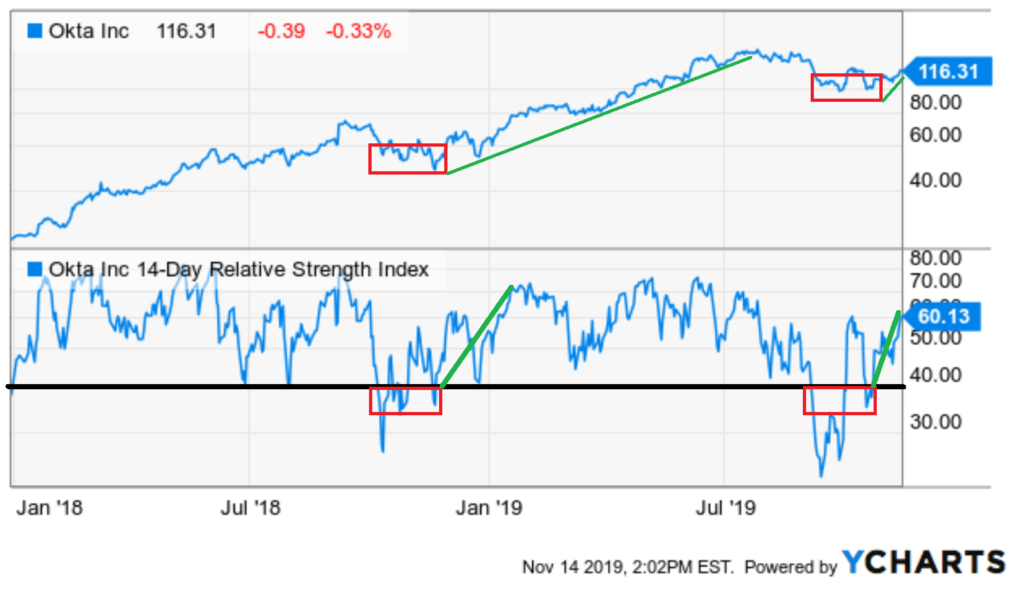
The story that OKTA’s chart tells is one of a stock that is breaking out after a brief period of consolidation. Okta has been a very strong stock. It spends very little time in oversold territory. But every once in a while, valuation friction rears its ugly head and OKTA stock does dip into oversold territory. See late 2018 or late 2019.
But with both the Relative Strength Index and stock rebounding, it appears OKTA is breaking out. The last time a breakout like this happened, OKTA stock marched from $60 to $140 in a matter of months.
Fundamentally, everything here checks out. This is a 50%-plus revenue growth company disrupting a multi-billion-dollar (and still growing) cybersecurity space with a one-of-a-kind, identity-based solution. Gross margins are huge (over 70%), so as long as revenue growth drives positive operating leverage in the long run, Okta has an opportunity to produce huge profits at scale.
Nothing about these fundamentals has changed over the past few months. OKTA stock just got hit by some valuation headwinds. Now, those headwinds have passed, and shares look ready to get back to their winning ways.
Chegg (CHGG)
Sixth, we have connected learning platform Chegg (NYSE:CHGG).
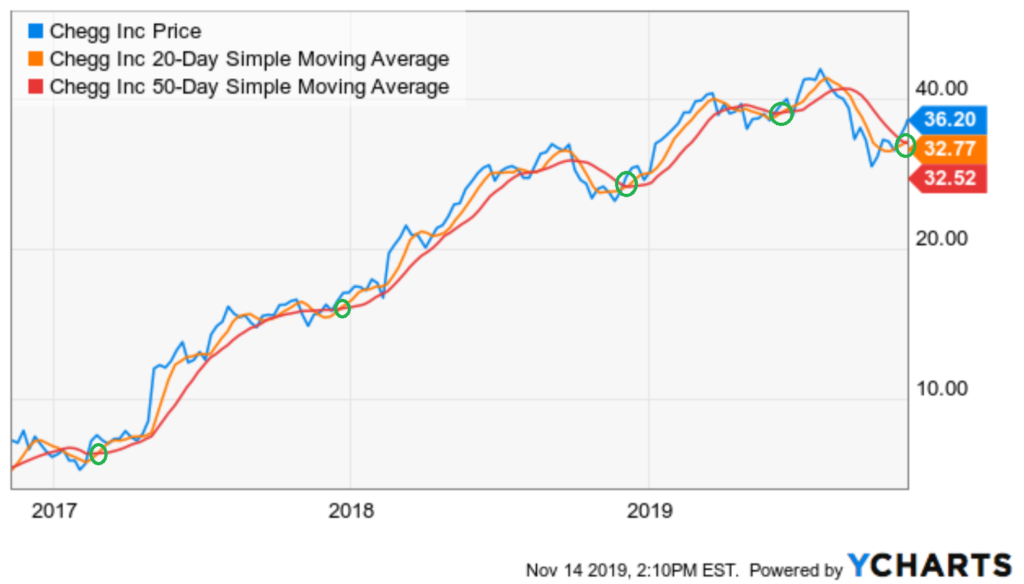
On the technical side of things, Chegg appears to be in the very early innings of a multi-quarter breakout. CHGG stock has been hit hard recently. But it has also shown signs of strength ever since a strong Q3 earnings report. This recent strength has propelled the stock’s 20-day moving average above its 50-day moving average for the first time in a few months. This bullish crossover signal has materialized just four times over the past three years. Each time, it preceded a huge move higher in CHGG stock.
On the fundamental side of things, Chegg’s strong Q3 earnings report confirmed that nothing has changed about this company’s fundamentals. Students still need academic help, and they are still seeking for that help through on-demand, connected learning platforms. In that space, Chegg remains unrivaled, and students continue to swarm onto the Chegg platform. Revenues, margins, and profits are all moving higher.
With the fundamentals still rock-solid and the technicals pointing to a big move higher, I think now is the time to double down on CHGG stock.
Etsy (ETSY)
Last but not least on this list of stocks to buy with great charts is specialty e-commerce marketplace Etsy (NASDAQ:ETSY).
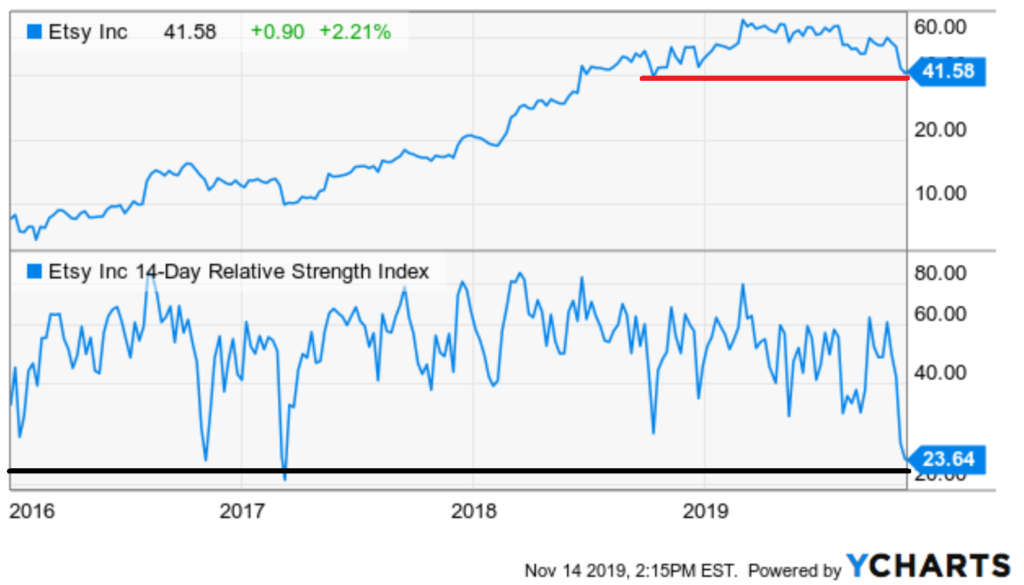
The technical picture on Etsy implies that you have a really oversold stock — one running into some big support — that’s due for a nice relief rally soon. Thanks to a convergence of headwinds, including disappointing earnings, ETSY stock has dropped into significantly oversold territory. Indeed, the RSI has only been this low on ETSY once before since 2016. At the same time, shares are running into multi-month support at $40. This combination of big support and dramatically oversold conditions should spark a recovery rally in ETSY stock.
The fundamentals here are weakening. Growth is slowing, and margins aren’t moving higher like they used to. Still, this is a 20%-plus volume growth company in a secular-growth e-commerce marketplace, with margins that are largely stable. In other words, it’s still a very good growth company with a favorable financial profile.
The valuation today doesn’t seem to reflect this. As such, buying the dip seems like the smart move.
As of this writing, Luke Lango was long SKX, TTD, T, OKTA, CHGG and ETSY.
