
It’s been a turbulent start to the year for the major market averages, with many sectors like Retail (XRT) and Staples (XLP) being hit by inflationary pressures and continued supply chain headwinds while worries about rate hikes leading to a cool-down in valuations in tech. However, one asset class that is holding its ground is gold (GLD), which is up 1% year-to-date, outperforming the Nasdaq by 700 basis points. This outperformance appears more than overdue, with gold typically performing its best when real rates are deep in negative territory, in line with the current backdrop. Let’s take a closer look below:

(Source: YCharts.com, Author’s Chart)
Looking at the chart above, we can see that real rates continue to trend lower and are now sitting at their lowest levels in decades, spurred by continued high single-digit inflation readings. This backdrop has typically been very favorable for gold, given that investors are not getting interest elsewhere, meaning there is no opportunity cost to holding the metal, and there is an opportunity cost to holding cash. The one impediment to gold’s performance, though, has been the fact that the major market averages have been climbing higher with a relentless bid, allowing investors to park their cash safely in the market.
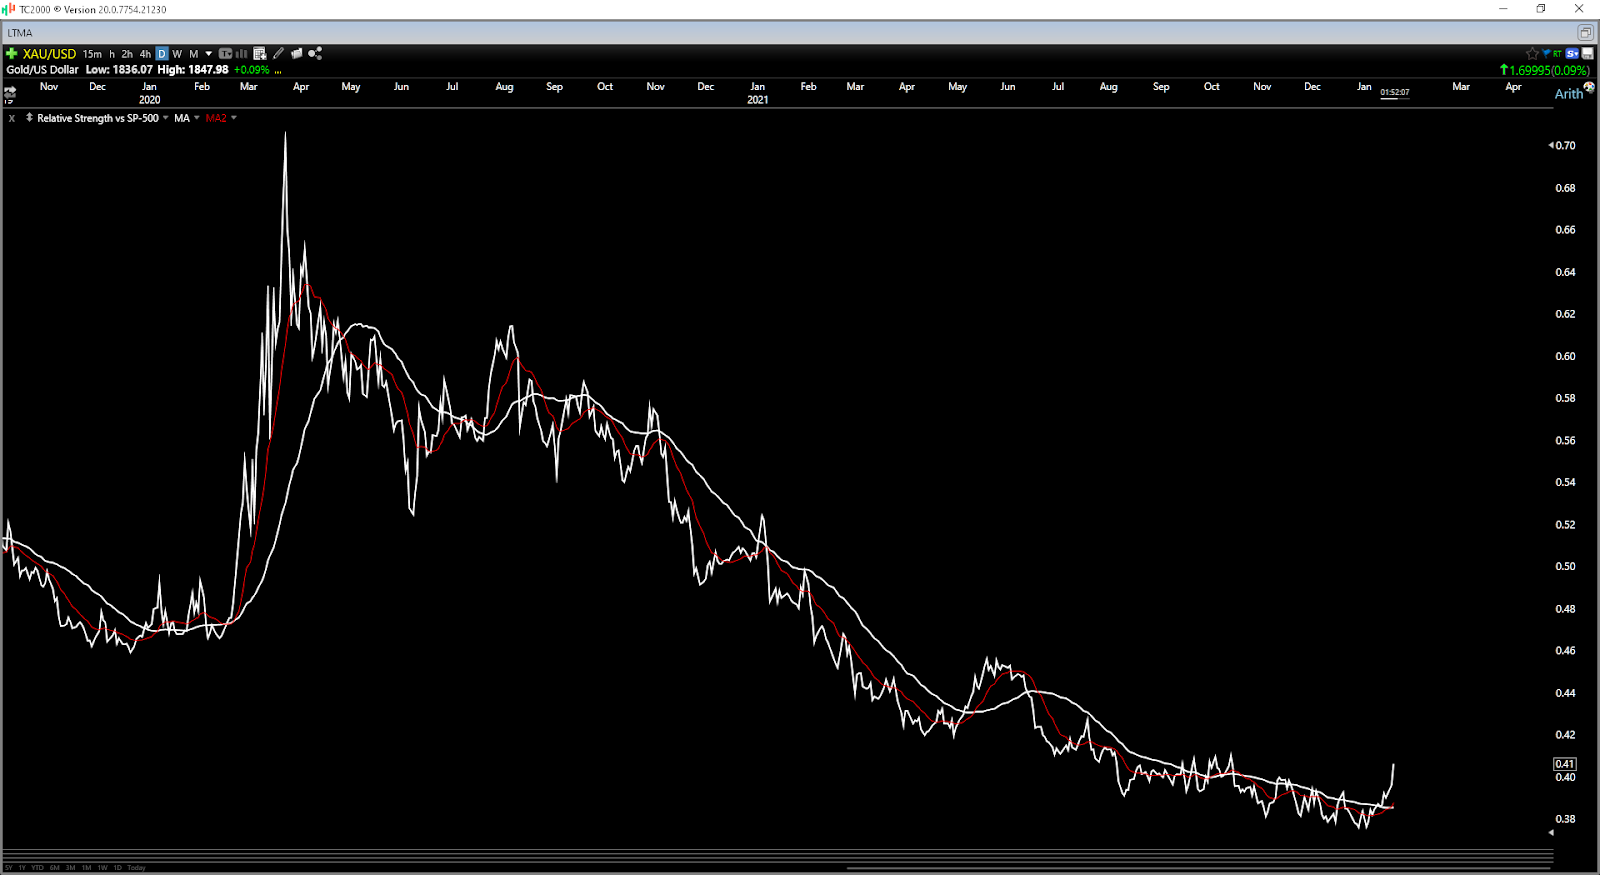
However, since the year began, this does not appear to be the case, and gold is massively outperforming the S&P-500, as well as growth and value ETFs. This has created a perfect storm for the metal, and its outperformance can be highlighted by the above chart, which shows gold recently breaking out to new multi-week highs vs. the S&P-500. A new trend upwards following a period of significant underperformance has typically led to sustained rallies in the gold price, with the most recent example being February 2020 ($1,500/oz to $2,050/oz). Hence, this is a very positive development for the gold bulls.
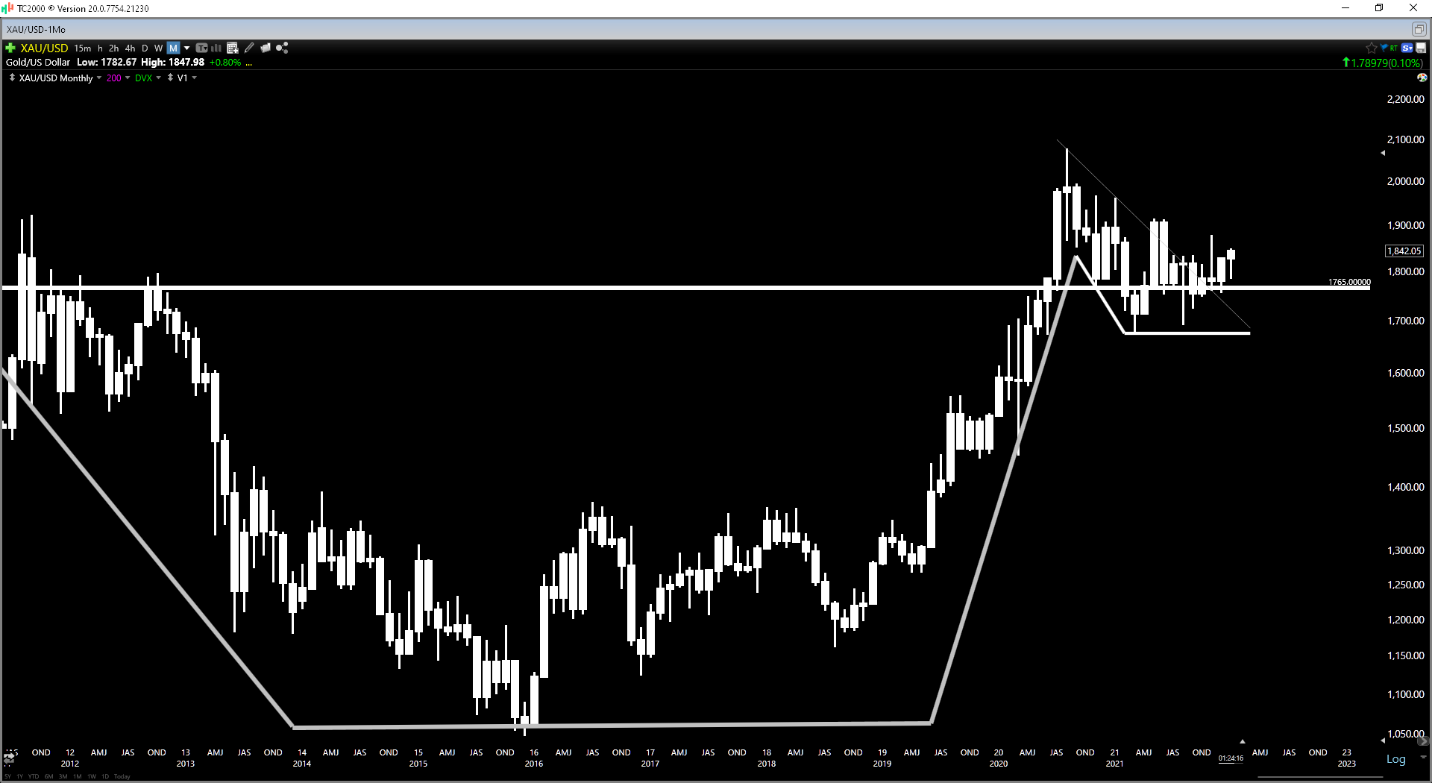
The key, however, is that gold’s outperformance vs. the S&P-500 is not simply due to the S&P-500 being in a bear market and gold trending lower, but just losing less ground. The good news is that this is not the case, with the monthly chart for gold showing that it is building a massive cup and handle, with much of its handle being built above its prior resistance. This is a very bullish long-term pattern, and a successful breakout above $2,000/oz would target a move to at least $2,350/oz.

(Source: TC2000.com)
Meanwhile, if we look at the yearly chart above, we can see an even better look at the cup and handle pattern and why the discussion that gold is dead or in a deep downtrend is simply incorrect. While one can certainly make the case that gold has gone nowhere over the past 18 months and the daily chart remains volatile, the big picture has rarely looked better in the past several decades, and zero technical damage has been done. So, for investors looking for an asset with a favorable fundamental backdrop that’s also sporting a very attractive looking long-term chart, I am hard-pressed to find anything as attractive as gold among the 150+ ETFs and assets I track.
(Source: TC2000.com)
So, what’s the best course of action?
One of my favored ways to play the gold sector is Agnico Eagle Mines (AEM). The reason is that it has one of the best margin profiles sector-wide; the potential to increase production by more than 30% over the next nine years, and it operates out of the most attractive jurisdictions globally. This is evidenced by the fact that AEM should be able to grow annual gold production from ~3.4 million ounces to ~4.5 million ounces between now and 2030 and has 50% margins at a $1,800/oz gold price.
(Source: TC2000.com)
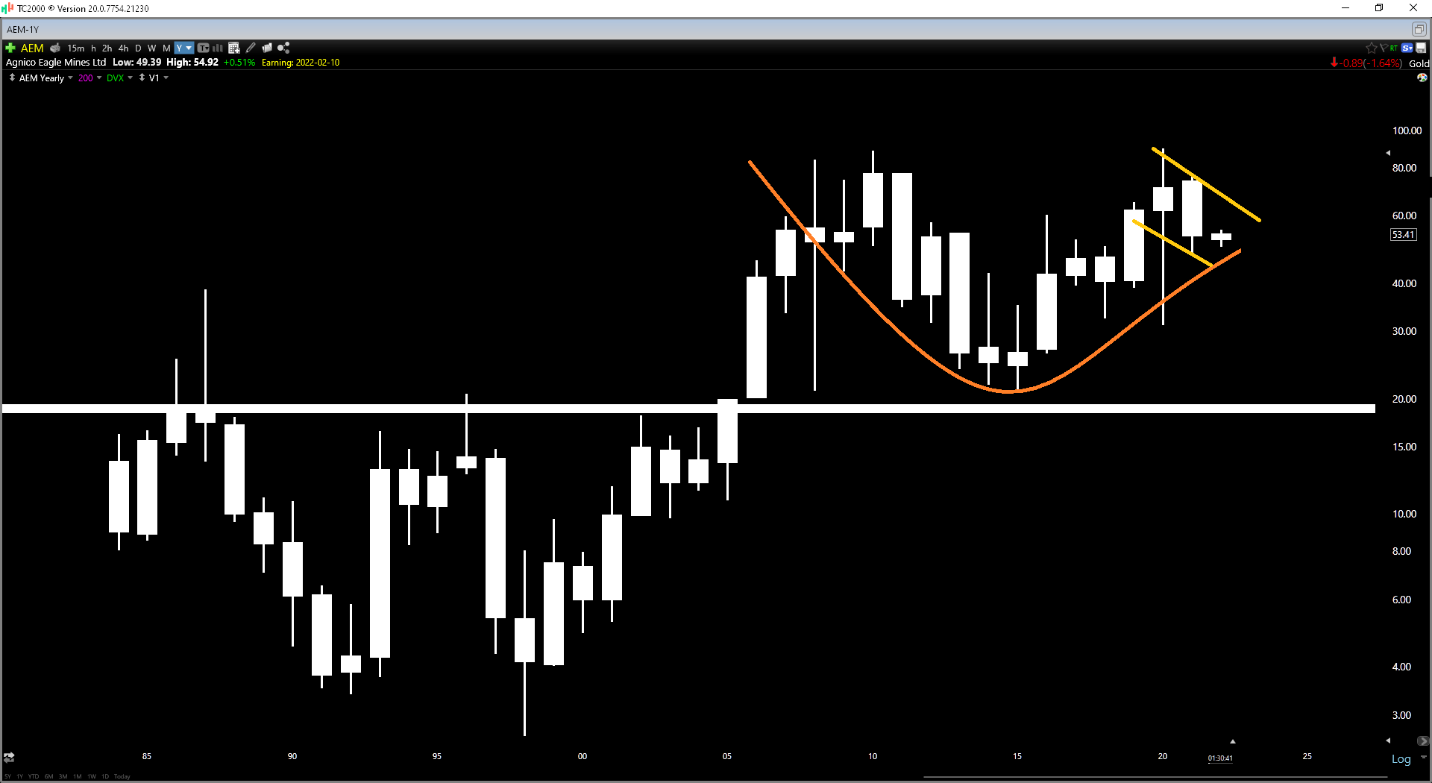
As the chart above shows, AEM’s technical picture continues to improve, with the stock building a 10+ year cup and handle base atop its prior multi-decade breakout level. This is a very bullish pattern, and a breakout above $70.00 would target a move above $95.00 in the next two years. So, with the stock consolidating near the right side of its cup and trading at a very attractive valuation of 1.0x P/NAV, I see this as an attractive entry point. Notably, AEM also pays a ~2.7% dividend yield, double that of the S&P-500. For those preferring to invest in gold, I continue to expect a trend of higher lows, with the $1,750/oz – $1,780/oz area representing a very low-risk buy zone.
It’s no secret that GLD has massively underperformed other ETFs over the past 18 months, and with many focused on the last shiny thing and having recency bias, it’s no surprise that gold remains out of favor. However, the best time to buy the metal is when it’s been hated and has corrected sharply from its highs, making this an attractive entry point. Given that most other ETFs could use a rest, and the fundamental backdrop remains very favorable for gold, I remain medium-term and long-term bullish, and I would not be surprised to see gold above $2,080/oz this year.
Disclosure: I am long GLD, AEM
Disclaimer: Taylor Dart is not a Registered Investment Advisor or Financial Planner. This writing is for informational purposes only. It does not constitute an offer to sell, a solicitation to buy, or a recommendation regarding any securities transaction. The information contained in this writing should not be construed as financial or investment advice on any subject matter. Taylor Dart expressly disclaims all liability in respect to actions taken based on any or all of the information on this writing. Given the volatility in the precious metals sector, position sizing is critical, so when buying precious metals stocks, position sizes should be limited to 5% or less of one’s portfolio.
Want More Great Investing Ideas?