The Hourly View for TFSL
At the moment, TFSL (Get Ratings)’s price is down $-0.52 (-2.73%) from the hour prior. This move is a reversal from the hour prior, which saw price move up. If you’re a trend trader, consider that the strongest clear trend on the hourly chart exists on the 100 hour timeframe. Regarding moving averages, it should first be noted that price has crossed the 20 hour moving average, resulting in them with price now being below it. The moving averages on the hourly timeframe suggest a bearishness in price, as the 20, 50, 100 and 200 are all in a bearish alignment — meaning the shorter duration moving averages are below the longer duration averages, implying a stable downward trend.
Out of Banking stocks, TFSL ranks 171st in regards to today’s price percentage change.
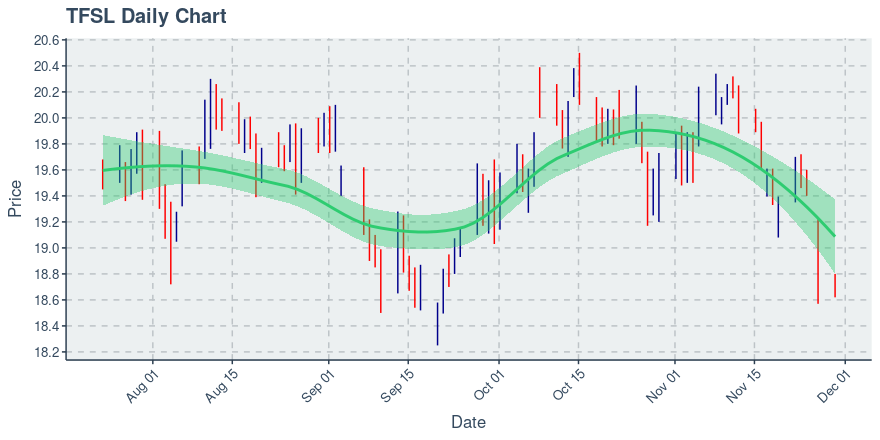
TFSL’s Technical Outlook on the Daily Chart
At the moment, TFSL’s price is down $-0.08 (-0.45%) from the day prior. It’s been a feast for bears operating on the daily timeframe, as TFSL has now gone down 8 of the past 10 days. If you’re a trend trader, consider that the strongest clear trend on the daily chart exists on the 20 day timeframe. The moving averages on the daily timeframe suggest a choppiness in price, as the 20, 50, 100 and 200 are all in a mixed alignment — meaning the trend across timeframes is inconsistent, indicating a potential opportunity for rangebound traders. The chart below shows TFSL’s price action over the past 90 days.
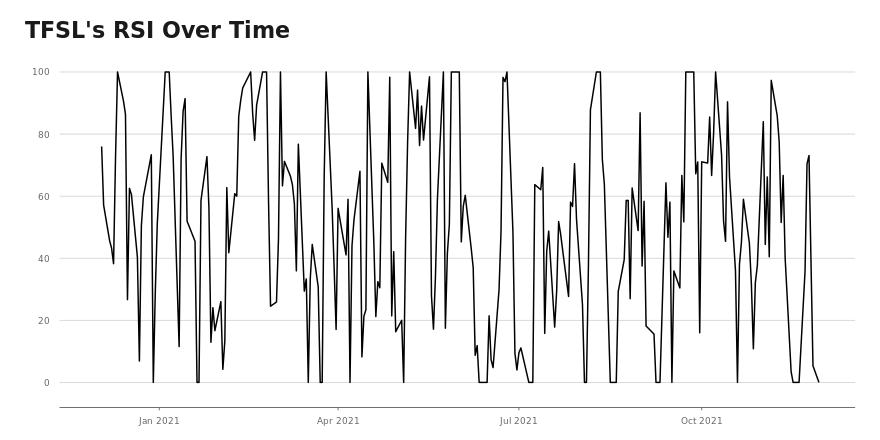
TFSL: Daily RSI Analysis
- For TFSL, its RSI is now at 0.
- TFSL and RSI may be exhibiting divergent trends. This may be something to monitor.
Want More Great Investing Ideas?
9 “MUST OWN” Growth Stocks for 2021
5 WINNING Stock Chart Patterns
7 Best ETFs for the NEXT Bull Market